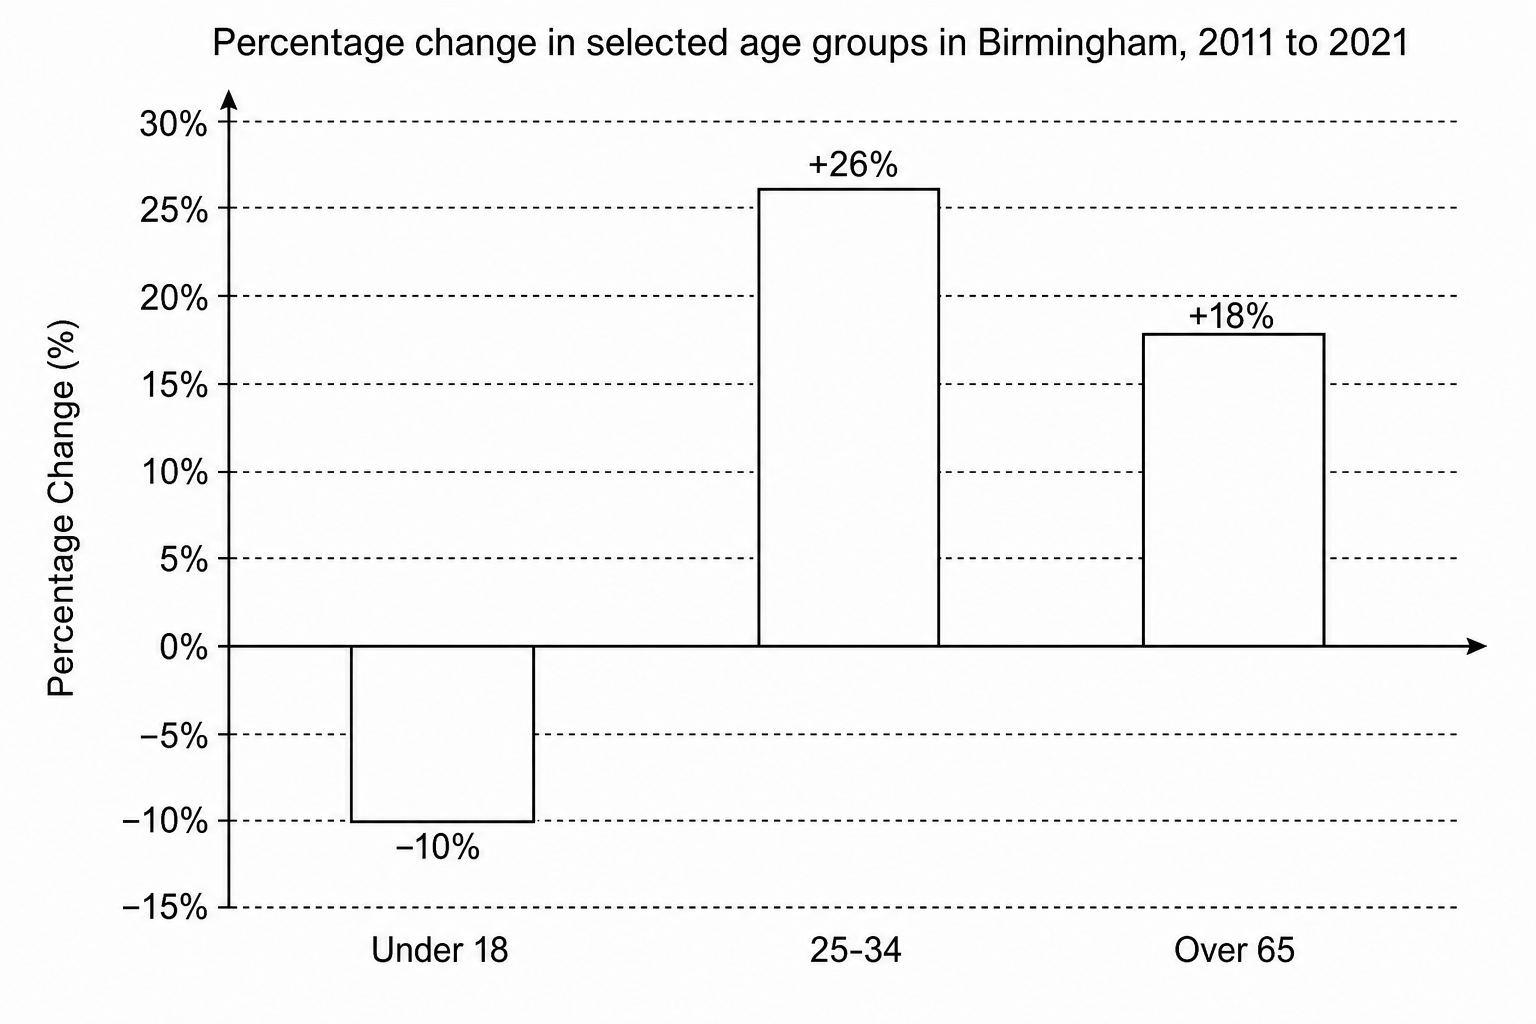
Study Figure 1a, which shows the net percentage change in Birmingham's age structure between 2011 and 2021.
State two possible impacts of the population change shown in Figure 1a.