Case study of a major city in a developing or emerging country

EasyMediumHard
1234567891011121314151617181920212223242526272829303132333435
Question 29
Easy

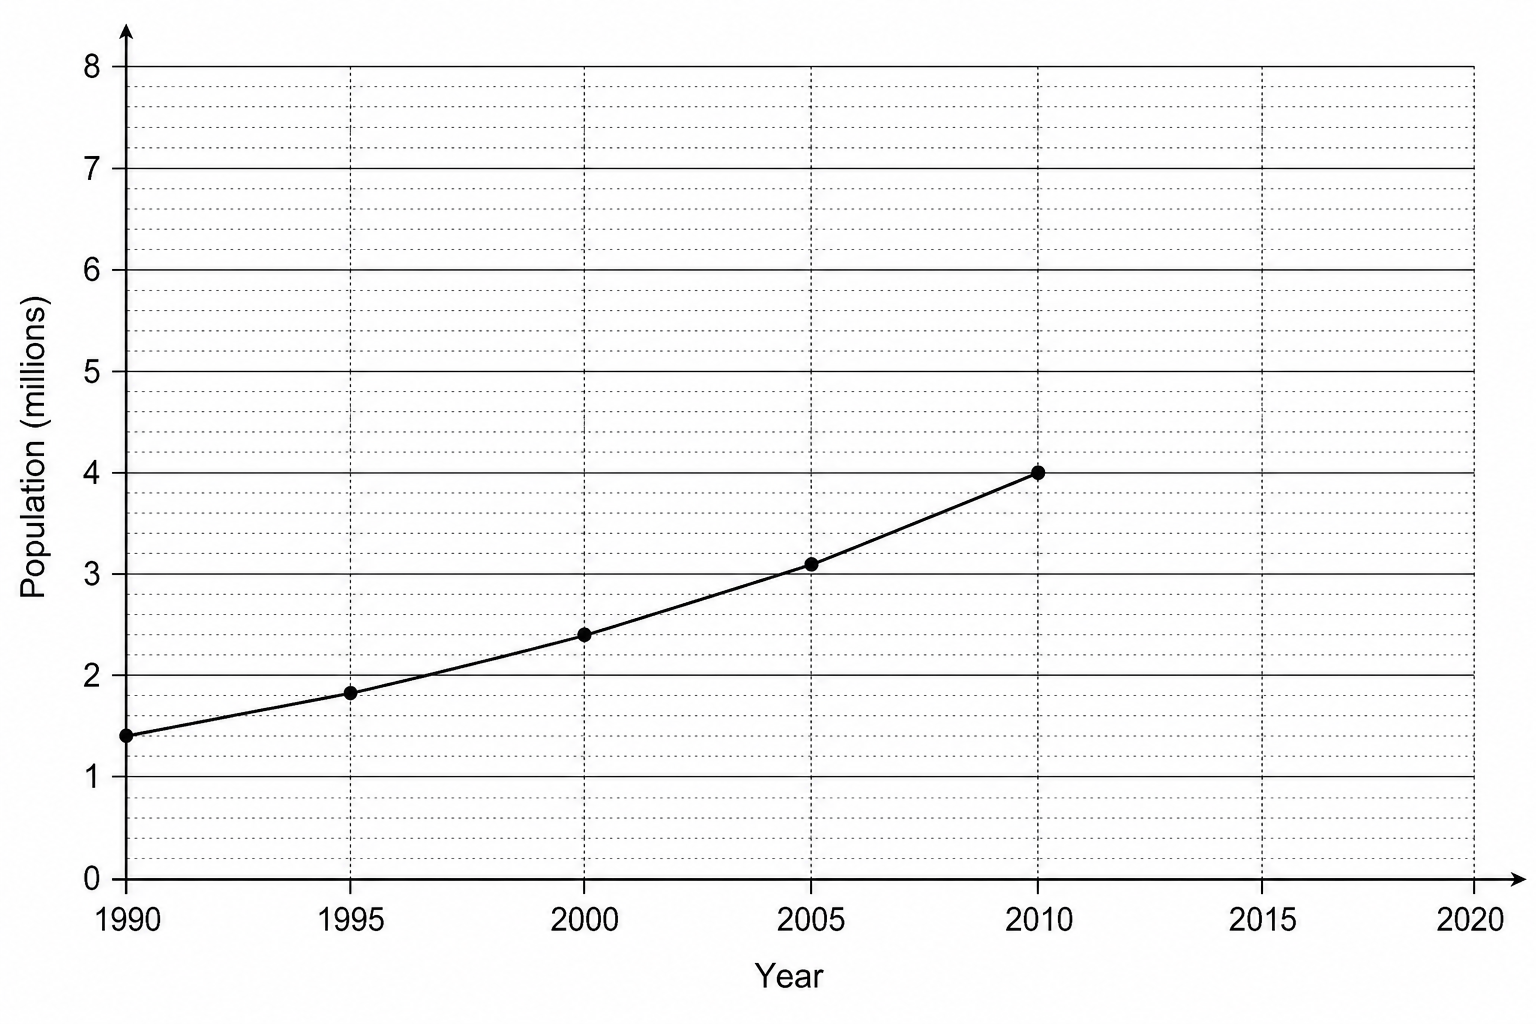
Complete Figure 1c by plotting the data below.

Table 1: Population of Dar es Salaam, Tanzania (2015-2020)

YearPopulation (millions)
20155.2
20206.4

Figure 1c: A line graph showing the population growth of Dar es Salaam, Tanzania from 1990 to 2020. The x-axis is labeled 'Year' from 1990 to 2020 with 5-year intervals (1990, 1995, 2000, 2005, 2010, 2015, 2020). The y-axis is labeled 'Population (millions)' and ranges from 0 to 8 with major grid lines every 1.0 million and minor grid lines every 0.2 million. The line correctly connects plotted points for 1990 (1.4 million), 1995 (1.8 million), 2000 (2.4 million), 2005 (3.1 million), and 2010 (4.0 million). The years 2015 and 2020 are not yet plotted on the graph.

[2]

Case study of a major city in a developing or emerging country Questions

  1. GCSE
  2. /Geography
  3. /Case study of a major city in a developing or emerging country