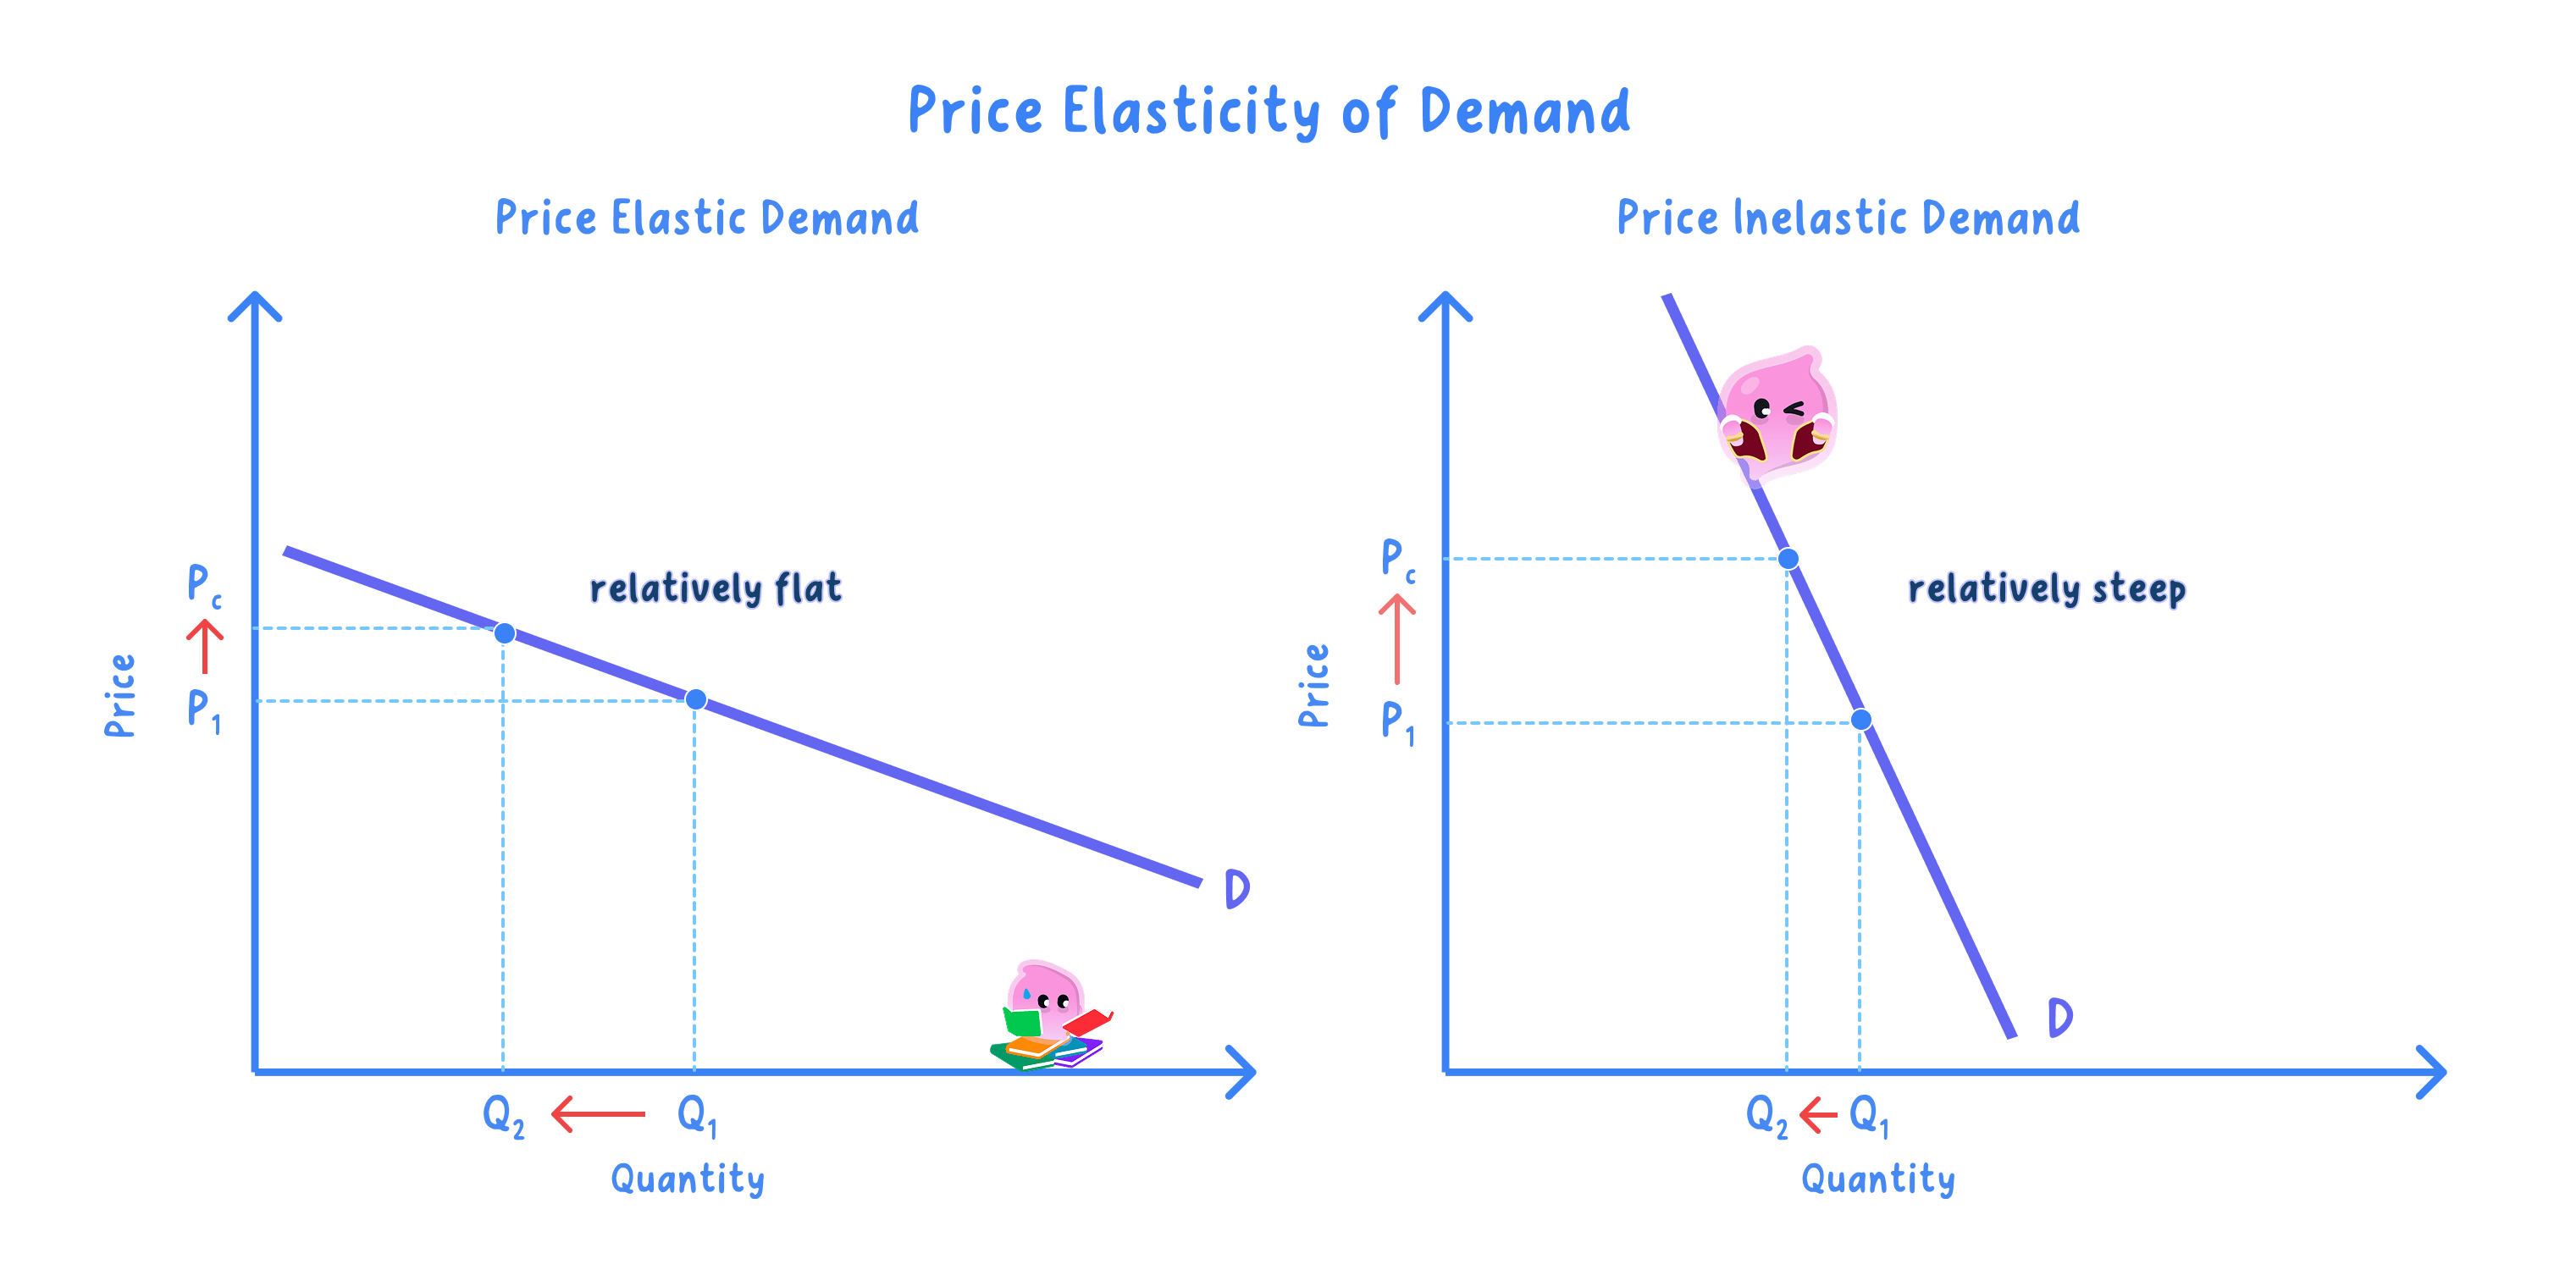
Steepness on the diagram shows the elasticity
- Both curves still slope down, so elasticity changes how steep the line is and never which way it goes.
- A steep demand curve is inelastic, because a large price change moves the quantity only a little.
- A shallow demand curve is elastic, because a small price change moves the quantity a lot.
The extremes are vertical and horizontal lines
Definition
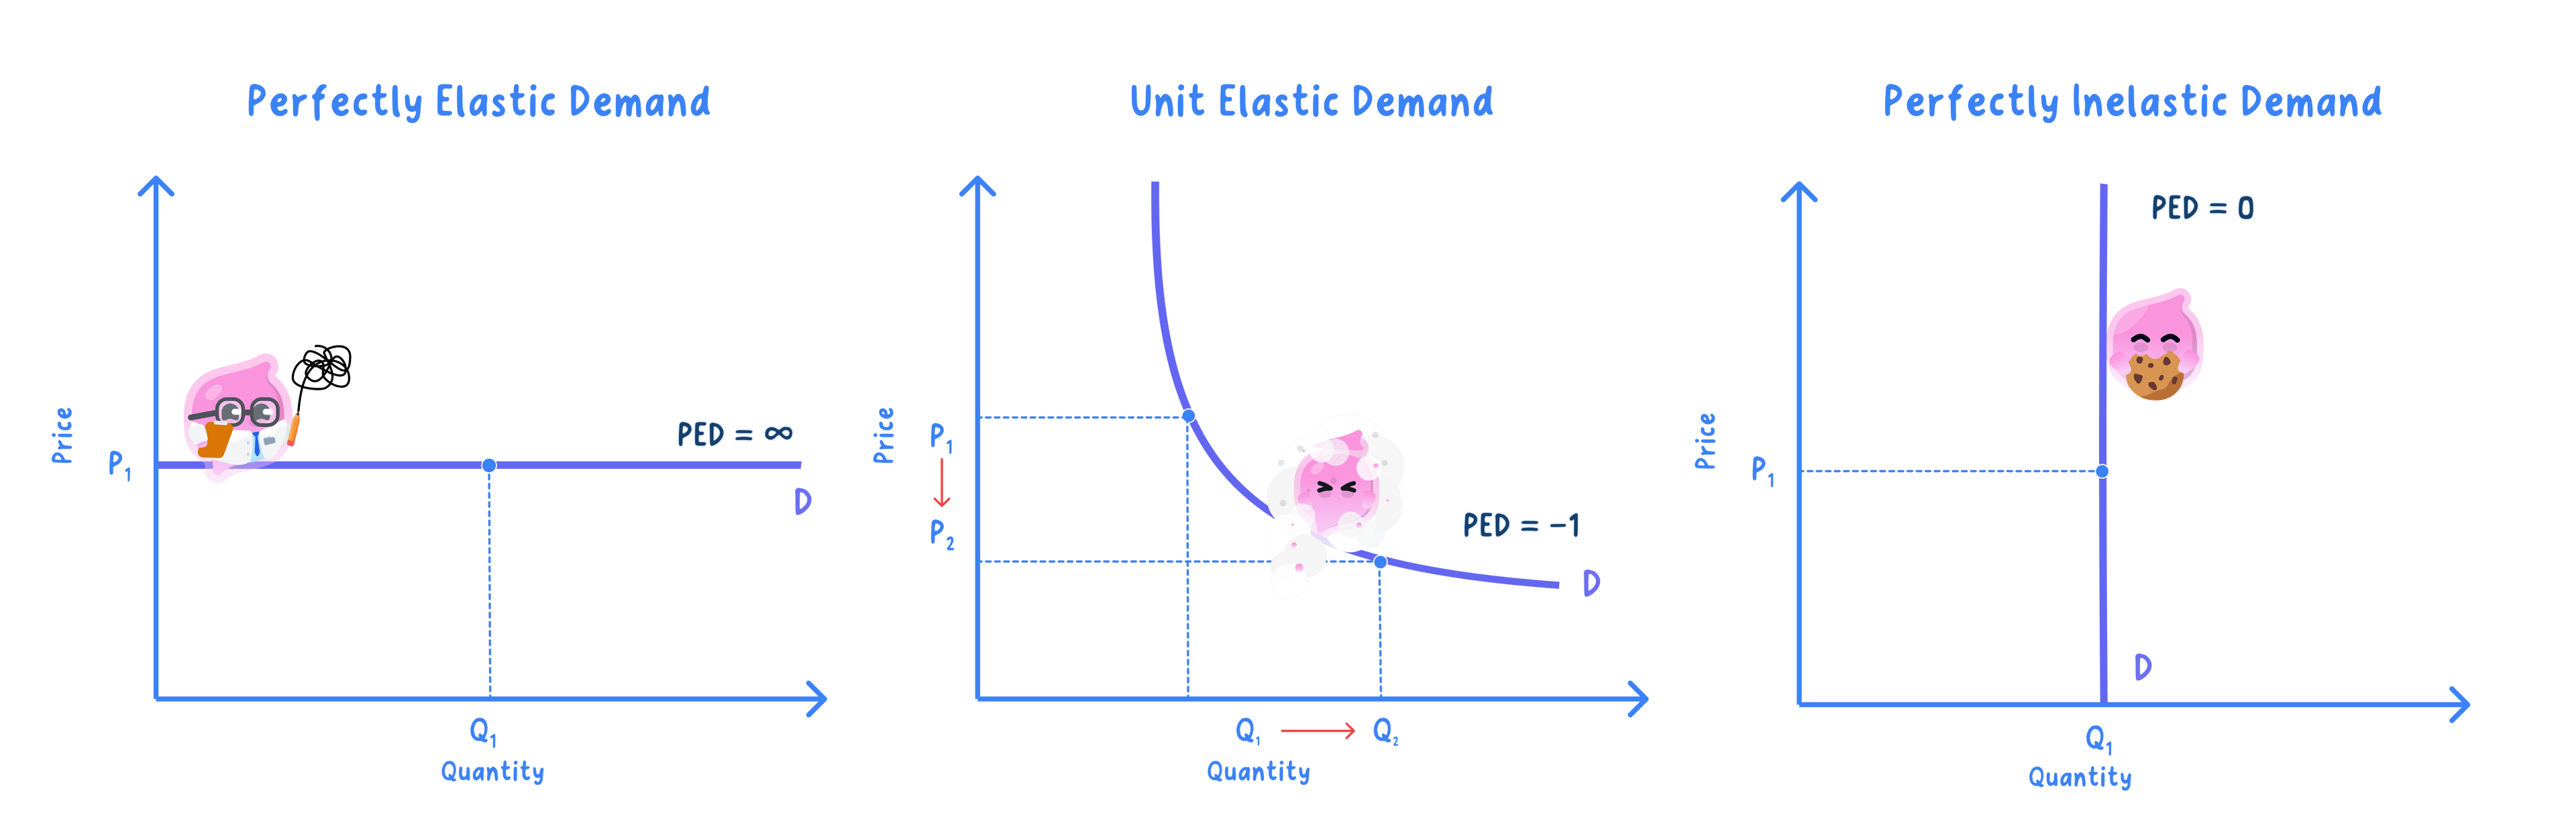
Perfectly inelastic demand: demand that does not change at all when price changes, drawn as a vertical line, where PED is 0.
Perfectly elastic demand: demand that falls to nothing if price rises at all, drawn as a horizontal line.
Unit elastic demand: demand where quantity changes by exactly the same percentage as price, so PED is 1 ignoring the minus sign.
- A vertical curve means the same quantity is bought whatever the price, which is the closest a diagram gets to a good with no alternative.
- A horizontal curve means buyers will pay one price and no more, which is closest to a single seller in a market full of identical rivals.
- Both are limiting cases used to anchor the scale, so real goods sit somewhere between them.
Draw the curve the question actually asks for
- Read the good first, because a necessity with no close substitute needs a steep curve and a single brand needs a shallow one.
- Label the axes and the curve D before drawing anything else, exactly as in 2.2.2.
- Show the price change with a horizontal line across to each curve, then drop down to read the quantities off.
Common Mistake
- Do not draw an elastic demand curve sloping upwards, since every demand curve falls from left to right whatever its elasticity.
- Do not call a curve elastic just because it looks long, because it is the slope and not the length that carries the meaning.
Exam technique
- Use the same price change on both curves when comparing, because different price changes prove nothing about elasticity.
- Say in words what the diagram shows, since a diagram left to speak for itself is rarely given full credit.
Self review
- Is a steep demand curve elastic or inelastic?
- How is perfectly inelastic demand drawn?
- What does a horizontal demand curve mean?
- What PED value is unit elastic demand?
- Why must the same price change be used on both curves when comparing them?
