Steepness and elasticity
Steepness and elasticity
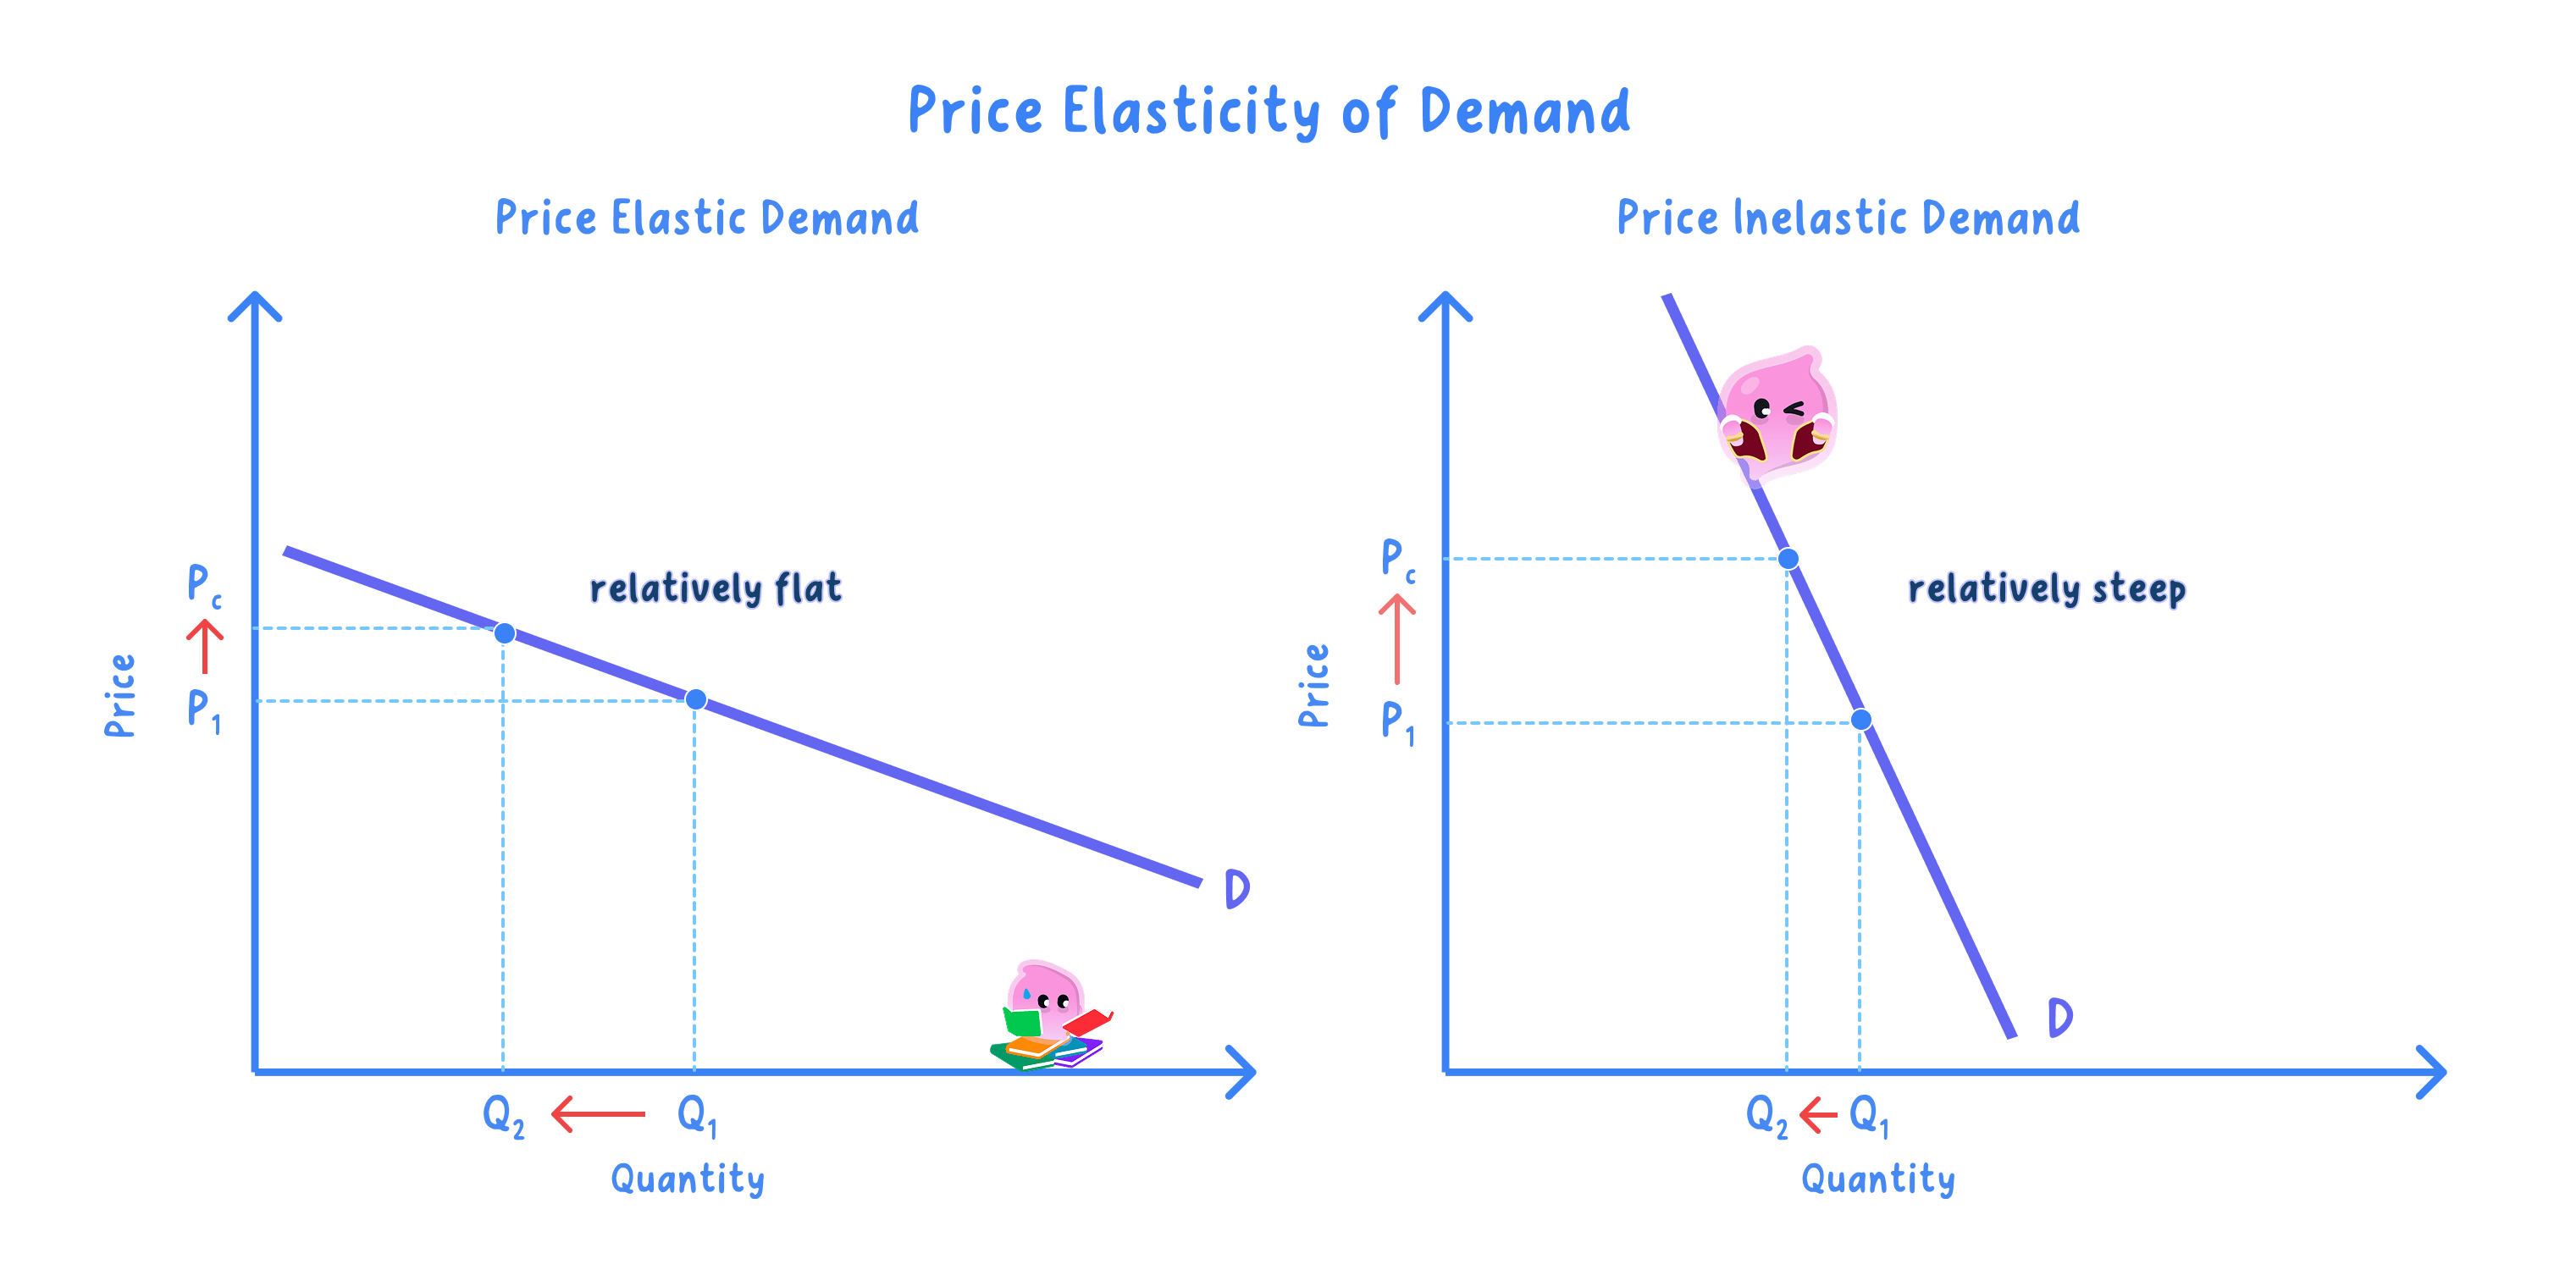
A demand curve normally slopes down from left to right because a higher price leads to a lower quantity demanded. Price elasticity of demand is the percentage change in quantity demanded divided by the percentage change in price, so elasticity changes how strongly quantity responds, not the direction of the curve.
2.2.7 Draw demand curves of different elasticity Lesson
Step-by-step lessons on OCR GCSE Economics 2.2.7 Draw demand curves of different elasticity. Each one builds up to exam-style questions. Build a solid grasp of supply and demand and cost/revenue calculations before tackling the evaluation-heavy policy topics.