What you'll learn
- What price elasticity of supply (PES) means.
- Why a price change does not always lead to the same size change in supply.
- The main factors that make supply more elastic or more inelastic.
- How to calculate PES and explain its effects on producers and consumers.
3.1.3.6 Price elasticity of supply
Before PES: supply and quantity supplied
A producer is a business or individual that makes and sells goods or services. For example, Greggs produces food, Tesco sells groceries, and a landlord supplies rental housing.
A supply curve is a graph showing the relationship between price and quantity supplied. It normally slopes upwards because higher prices create an incentive for producers to supply more.
Supply and quantity supplied
Supply is the amount producers are willing and able to sell at different prices over a period of time. Quantity supplied is the amount producers are willing and able to sell at one particular price.
PES is about a movement along the supply curve caused by a change in price. It is not about the whole supply curve shifting because of something else, such as higher energy costs, a new tax, or better technology.
Movement, not shift
If the question asks about PES, focus on how quantity supplied responds to a price change. Do not start explaining a shift in supply unless the question gives a non-price factor such as costs, subsidies, weather or technology.
What price elasticity of supply means
Prices act as signals and incentives. If the price of a product rises, producers may want to supply more because they can earn more revenue. But they may not be able to increase output quickly.
For example, a café might make more sandwiches tomorrow if prices rise, but a housebuilder cannot instantly produce thousands of extra homes. So the same price change can lead to very different supply responses.
Price elasticity of supply
Price elasticity of supply (PES) measures how responsive quantity supplied is to a change in price.
Responsiveness, not just direction
Supply usually moves in the same direction as price: when price rises, quantity supplied tends to rise. PES tells you how much quantity supplied changes compared with the price change.
Price-elastic and price-inelastic supply
Supply can be described as price-elastic or price-inelastic.
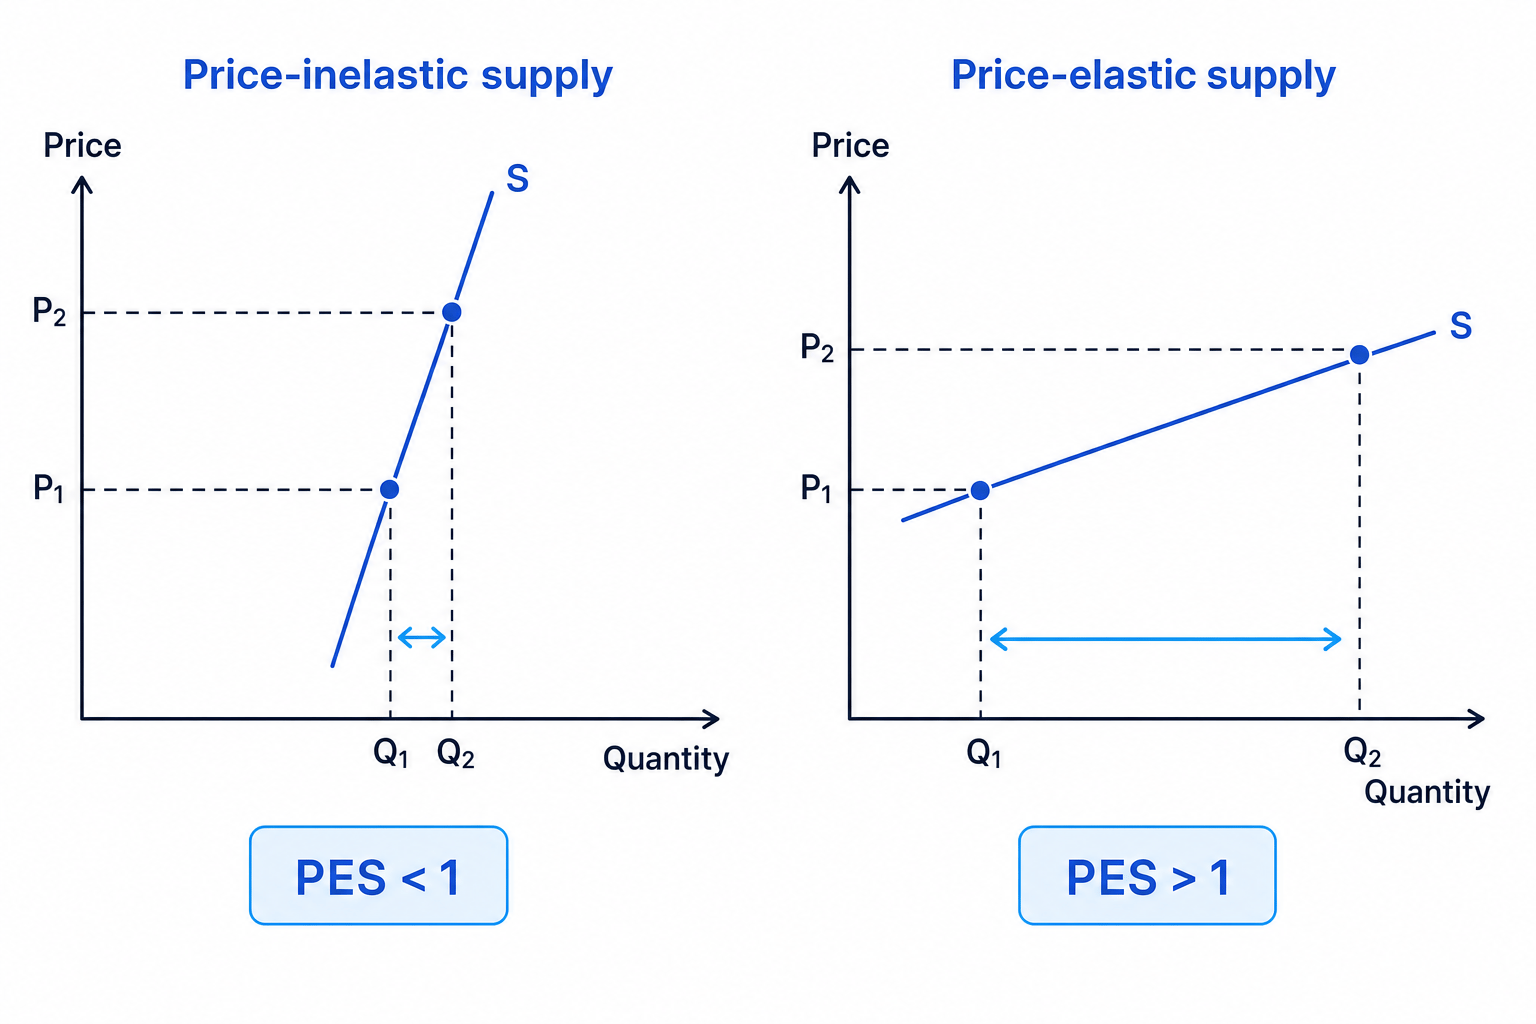
- Price-elastic supply means quantity supplied changes by a larger percentage than price. This gives PES>1\text{PES} > 1PES>1.
- Price-inelastic supply means quantity supplied changes by a smaller percentage than price. This gives PES<1\text{PES} < 1PES<1.
- Unit elastic supply means quantity supplied changes by the same percentage as price. This gives PES=1\text{PES} = 1PES=1.
A flatter supply curve suggests supply is more elastic. A steeper supply curve suggests supply is more inelastic.
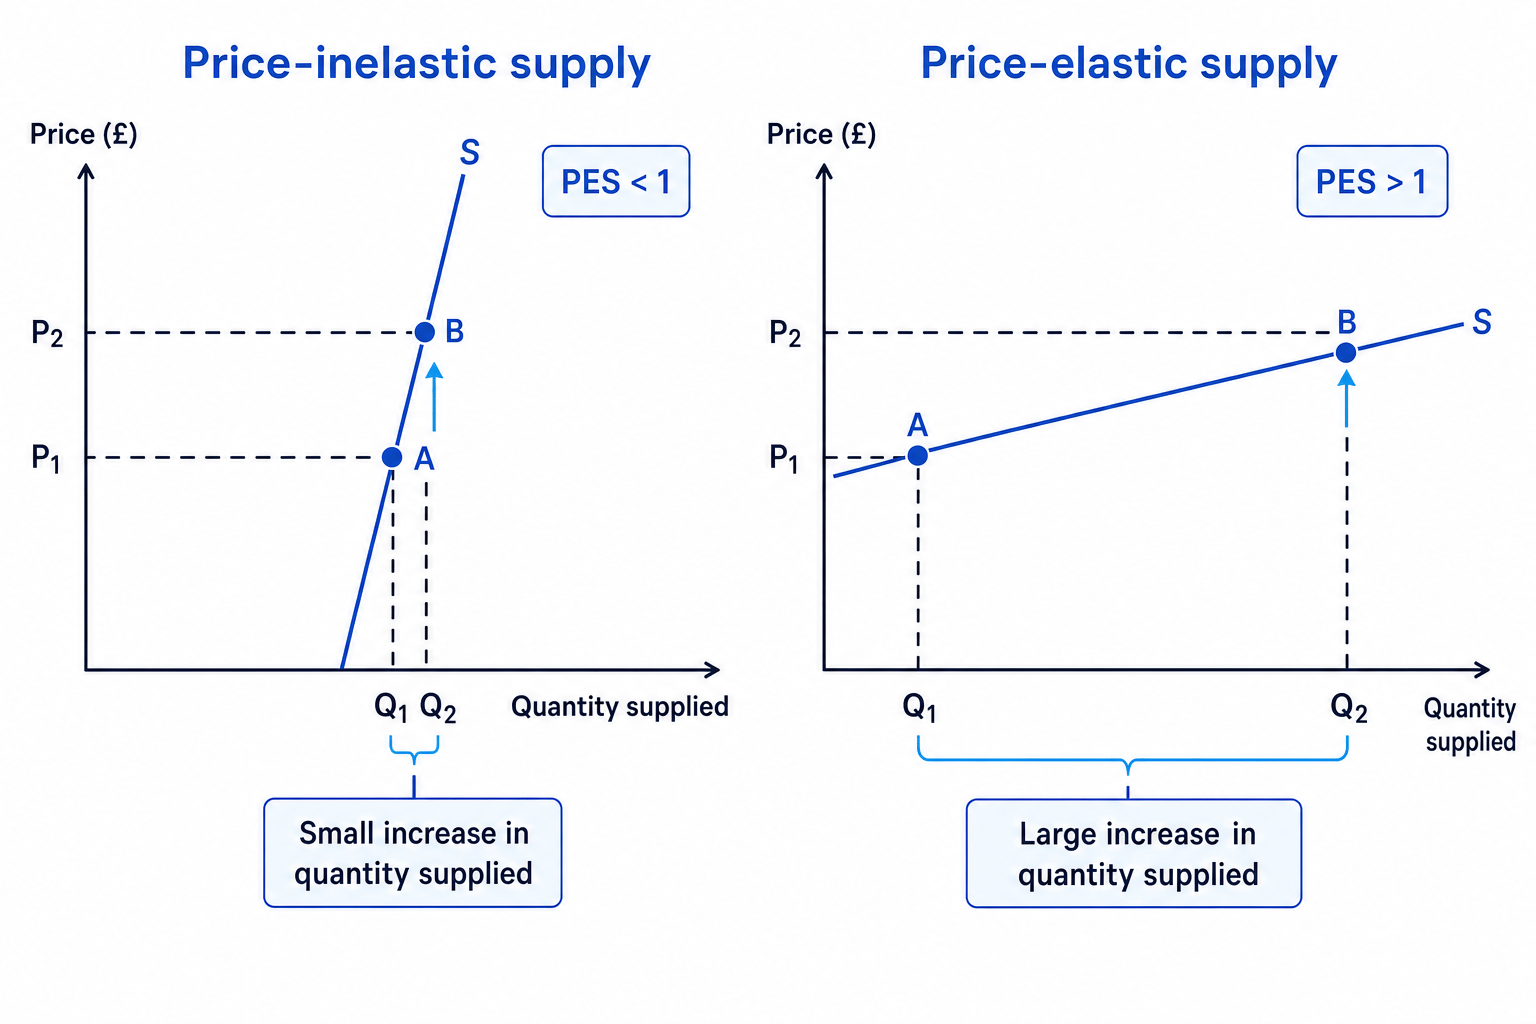
Diagram shortcut
For GCSE diagrams, think: steep supply = small quantity response = inelastic; shallow supply = large quantity response = elastic. If data is given, the calculation is more important than the visual clue.
Measuring price elasticity of supply
PES is calculated using percentage changes:
PES=percentage change in quantity suppliedpercentage change in price\text{PES}=\frac{\text{percentage change in quantity supplied}}{\text{percentage change in price}}PES=percentage change in pricepercentage change in quantity suppliedTo find a percentage change, use:
Percentage change=new value−old valueold value×100\text{Percentage change}=\frac{\text{new value}-\text{old value}}{\text{old value}}\times 100Percentage change=old valuenew value−old value×100The PES answer has no units, because a percentage is divided by a percentage. PES is normally positive because price and quantity supplied usually move in the same direction.
Calculating PES for bakery output
A small UK bakery raises the price of a cake from £1.20 to £1.32. Its weekly quantity supplied rises from 10,000 cakes to 10,800 cakes.
-
Calculate the percentage change in price: £1.32 - £1.20 = £0.12, so £0.12£1.20×100=10%\frac{\text{£0.12}}{\text{£1.20}}\times 100 = 10\%£1.20£0.12×100=10%.
-
Calculate the percentage change in quantity supplied: 10,800 - 10,000 = 800 cakes, so 80010,000×100=8%\frac{800}{10{,}000}\times 100 = 8\%10,000800×100=8%.
-
Substitute into the PES formula: PES=8%10%=0.8\text{PES}=\frac{8\%}{10\%}=0.8PES=10%8%=0.8.
-
Classify the result: because PES<1\text{PES}<1PES<1, supply is price-inelastic. The bakery increased supply, but by a smaller percentage than the price rise, perhaps because it had limited ovens or staff.
Using absolute changes instead of percentages
Do not compare £0.12 with 800 cakes. PES uses percentage change in quantity supplied divided by percentage change in price, not the raw changes.
Factors affecting price elasticity of supply
Supply tends to be more elastic when producers can increase output quickly and cheaply. It tends to be more inelastic when production is slow, difficult or limited.
The main factors are:
- Time period: supply is usually more inelastic in the short run and more elastic in the long run. Over time, firms can hire workers, buy machinery or open new sites.
- Spare capacity: spare capacity means unused resources, such as empty factory space or workers with available hours. More spare capacity makes supply more elastic.
- Stocks and storage: stocks are goods kept ready for sale. If a producer has stock available and the product can be stored, supply is more elastic. Services like haircuts cannot be stored.
- Availability of factors of production: the factors of production are land, labour, capital and enterprise. If skilled workers, materials or machinery are hard to get, supply is more inelastic.
- Length and complexity of production: products that take a long time to make, such as new homes, aircraft or energy infrastructure, usually have more inelastic supply.
- Mobility of resources: if resources can be switched from one use to another easily, supply is more elastic. For example, a food factory may switch production lines more easily than a hospital can train extra nurses.
Recent UK examples make this clearer. During COVID-19, some firms could increase production of hand sanitiser fairly quickly because they had suitable equipment. But new housing supply has remained relatively inelastic because land, planning permission, materials and skilled labour can all be constraints.
Comparing supply responsiveness
Compare ice cream sold by a supermarket with new homes built in the UK.
-
Consider time: supermarkets can order more ice cream within days or weeks, but new homes take months or years to plan and build.
-
Consider storage and stocks: ice cream can be stored in freezers, but completed homes cannot be produced and stored in the same flexible way.
-
Consider inputs: housebuilding needs land, planning permission, building materials and skilled labour, so it faces more constraints.
-
Reach a judgement: ice cream supply is likely to be more price-elastic than new housing supply, especially in the short run.
Sustainability and ethics can matter too. A producer might respond to higher prices by increasing output quickly, but this could involve more overtime, pressure on workers, higher emissions or overuse of natural resources. Economists often ask not only “Can supply increase?” but also “Should it increase in that way?”
Implications for producers and consumers
PES affects how markets adjust when conditions change. Demand is the amount consumers are willing and able to buy at different prices. Equilibrium price is the price where demand equals supply.
If demand rises, the elasticity of supply affects whether the main result is a higher price, a larger quantity, or both.
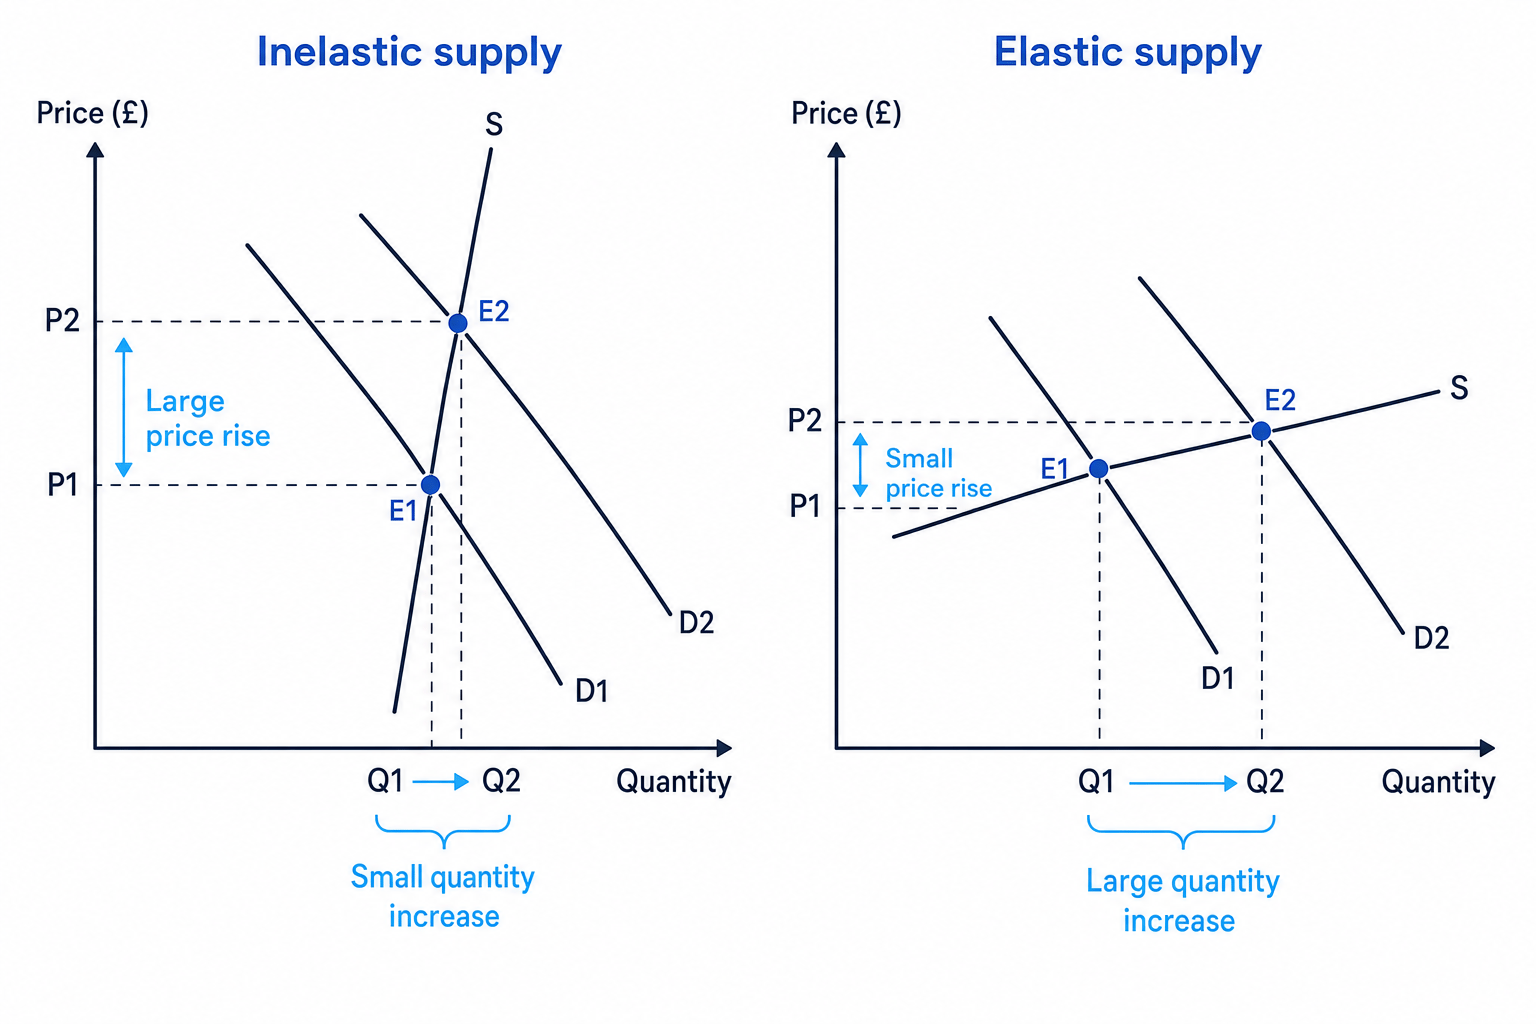
For consumers, inelastic supply can mean prices rise sharply when demand increases or when supply is disrupted. This is a major issue for essentials such as housing and energy, where consumers may have little choice but to pay more.
For producers, elastic supply can be an advantage because they can respond to higher prices by selling much more. Inelastic supply can mean firms miss out on potential sales, although firms that already have scarce products may benefit from higher prices.
For government, inelastic supply in important markets can create pressure to intervene. For example, during the 2022–23 cost-of-living squeeze, high energy prices affected households and businesses, leading to government support such as the Energy Price Guarantee.
Demand rising when supply is inelastic
Imagine demand for rented flats rises in a UK city because more jobs are created there, but new flats take years to build.
-
Identify the supply condition: rental housing supply is price-inelastic in the short run because the number of homes cannot rise quickly.
-
Apply the diagram logic: demand shifts right, but a steep supply curve means quantity increases only slightly.
-
Analyse the impact: tenants face much higher rents, while landlords may receive higher rental income.
-
Make a judgement: consumers are likely to be worse off in the short run, especially lower-income renters, unless extra housing supply or support becomes available.
In the exam
-
Define PES clearly: it measures the responsiveness of quantity supplied to a change in price.
-
For calculations, find both percentage changes first, then use PES=percentage change in quantity suppliedpercentage change in price\text{PES}=\frac{\text{percentage change in quantity supplied}}{\text{percentage change in price}}PES=percentage change in pricepercentage change in quantity supplied and compare the answer with 1.
-
For explanation questions, link PES to the context: time period, spare capacity, stocks, inputs and the effects on both producers and consumers.
Check yourself
- If price rises by 20% and quantity supplied rises by 5%, is supply price-elastic or price-inelastic?
- Name two reasons why the supply of new homes is likely to be inelastic in the short run.
- Explain one consequence for consumers when demand rises but supply is price-inelastic.