

What you'll learn
- The difference between income inequality and wealth inequality.
- Why income is unevenly distributed in the UK.
- How inequality affects households, firms, government and society.
- How taxation and government spending can redistribute income and wealth.
3.2.2.6 Distribution of income: the big picture
This topic sits inside government objectives because governments do not only care about growth, inflation and unemployment. They also care about how income is shared across the population.
A country can have a high GDP, but still have households who struggle to afford food, heating and housing. That is why economists look at the distribution of income, not just the total amount produced.
Income, wealth and inequality
- Income is a flow of money received over a period of time, such as wages, salaries, rent, interest, profit or benefits.
- Wealth is the stock of assets a person owns, such as savings, property, shares and pensions, minus debts.
- Income inequality means income is distributed unevenly between people or households.
- Wealth inequality means wealth is distributed unevenly between people or households.
Income and wealth are linked, but not the same
You can have a high income but low wealth if you spend most of what you earn. You can also have low income but high wealth, for example a retired homeowner with a valuable house but a modest pension.
Wealth can create more income. For example, someone who owns a rental property may receive rent. Someone with large savings may receive interest, especially when Bank of England base rates rise.
Confusing income and wealth
Do not write “income” when you mean “wealth”. Income is measured over time, such as “£30,000 per year”. Wealth is measured at a point in time, such as “£250,000 in savings and property”.
The distribution of income in the UK
The distribution of income means how the UK’s total income is shared between households. It is not shared equally.
In general, households with higher earnings, more working adults, higher skills, property income and investment income receive more. Households with unemployment, low-paid work, illness, caring responsibilities or insecure work often receive less.
Economists often compare income groups using quintiles. A quintile is one fifth of the population after households are ranked from lowest income to highest income.
Market income and disposable income
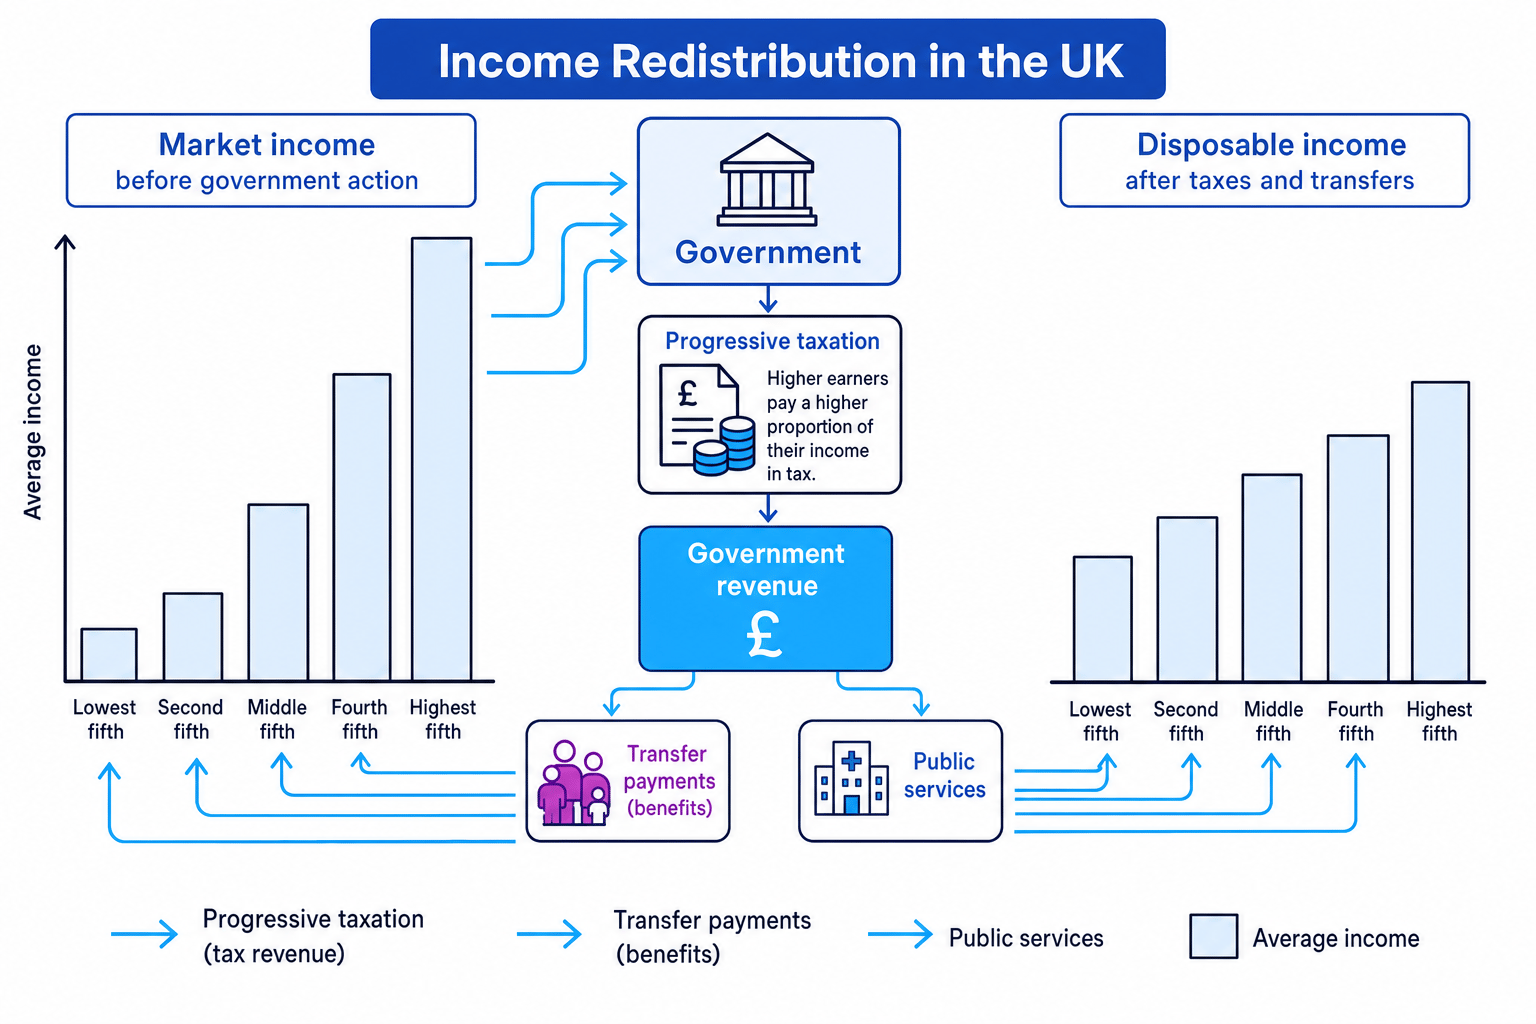
Market income is income before government taxes and benefits. Disposable income is income after taxes and benefits, so it is closer to the money households can actually spend or save.
In the UK, market income is more unequal than disposable income because the government takes taxes from households and pays benefits or provides services. This does not remove inequality, but it usually reduces it.
Measuring a simple income distribution
Five households have annual incomes of £10,000, £15,000, £25,000, £40,000 and £110,000.
-
Add the five incomes to find total income:
£10,000+£15,000+£25,000+£40,000+£110,000=£200,000\pounds 10{,}000 + \pounds 15{,}000 + \pounds 25{,}000 + \pounds 40{,}000 + \pounds 110{,}000 = \pounds 200{,}000£10,000+£15,000+£25,000+£40,000+£110,000=£200,000. -
Calculate the highest-income household’s share:
£110,000£200,000×100=55%\frac{\pounds 110{,}000}{\pounds 200{,}000} \times 100 = 55\%£200,000£110,000×100=55%. -
Calculate the lowest-income household’s share:
£10,000£200,000×100=5%\frac{\pounds 10{,}000}{\pounds 200{,}000} \times 100 = 5\%£200,000£10,000×100=5%. -
Compare the shares: the highest-income household receives 55% of total income, while the lowest receives 5%, so income is distributed very unequally.
Be precise about the income measure
If you are analysing inequality, say whether you mean market income, gross income, net income or disposable income. Taxes and benefits can change the picture a lot.
How inequality in the distribution of income can occur
Income inequality does not have one single cause. It usually comes from several factors working together.
Differences in wages and salaries
Most working-age households receive much of their income from work. Wages can differ because of:
- Skills and qualifications: workers with scarce or highly valued skills often earn more.
- Experience and training: experienced workers may be more productive.
- Hours worked: full-time workers usually earn more than part-time workers.
- Occupation and industry: finance, technology and law often pay more than retail or hospitality.
- Regional differences: some areas, such as London and the South East, often have higher wages but also higher living costs.
Unemployment and economic inactivity
A household with no one in paid work will usually have lower market income. People may be unemployed because firms are cutting jobs, because they lack suitable skills, or because demand in their local area is weak.
During the COVID-19 pandemic, some workers in hospitality, travel and retail faced reduced hours or job insecurity. Government support, such as furlough, helped protect many incomes, but the shock still showed how quickly incomes can change.
Wealth and inherited advantage
Wealth inequality can make income inequality worse. If a person owns property, shares or a business, they may receive rent, dividends or profit. If they inherit wealth, they may be able to buy a house earlier, avoid rent, or invest in education and training.
This creates a moral and ethical debate: is inequality acceptable if it rewards effort and enterprise, or unfair if it mainly reflects family background and inherited wealth?
Household circumstances
Two people on the same hourly wage may have very different living standards. A single adult with no children, a couple with two earners, and a lone parent with childcare costs all face different financial pressures.
Explaining unequal earnings
A full-time software developer in London earns much more than a part-time retail worker in a small town.
-
Compare skills and demand: digital skills may be scarce and highly demanded by firms, so employers are willing to pay more for the software developer.
-
Compare hours worked: if the developer works 37.5 hours per week and the retail worker works 16 hours, the annual income gap becomes larger even before comparing hourly pay.
-
Compare labour-market conditions: London firms may have higher revenues and greater ability to pay, while retail employers may face strong price competition and tighter profit margins.
Consequences of income and wealth inequality
Inequality creates both costs and possible benefits. In exams, strong answers usually recognise this trade-off.
Inequality is a trade-off
Some inequality can create incentives to work, study, save and take business risks. However, too much inequality can reduce living standards, opportunity and social cohesion.
Effects on households
Low-income households may struggle to afford essentials such as food, energy, housing and transport. This can reduce health, educational outcomes and future job opportunities.
Wealth inequality also matters. A household with savings can cope better with unexpected costs, such as a broken boiler or a period out of work. A household with no savings may need to borrow, increasing debt.
The 2022–23 cost-of-living squeeze hit many lower-income households especially hard because they spend a larger proportion of their income on necessities like energy and food.
Analysing the cost-of-living squeeze
A lower-income household earns £18,000 and spends £7,200 on food and energy. A higher-income household earns £60,000 and spends £12,000 on food and energy. Prices of food and energy rise by 20%.
-
Calculate the lower-income household’s extra cost:
0.20×£7,200=£1,4400.20 \times \pounds 7{,}200 = \pounds 1{,}4400.20×£7,200=£1,440.
As a share of income: £1,440£18,000×100=8%\frac{\pounds 1{,}440}{\pounds 18{,}000} \times 100 = 8\%£18,000£1,440×100=8%. -
Calculate the higher-income household’s extra cost:
0.20×£12,000=£2,4000.20 \times \pounds 12{,}000 = \pounds 2{,}4000.20×£12,000=£2,400.
As a share of income: £2,400£60,000×100=4%\frac{\pounds 2{,}400}{\pounds 60{,}000} \times 100 = 4\%£60,000£2,400×100=4%. -
Compare the impact: the higher-income household pays more in pounds, but the lower-income household faces the bigger squeeze relative to its income.
Effects on the wider economy and society
High inequality can reduce social mobility, which means people’s ability to move to a higher income or social position than their parents. If poorer households cannot afford good housing, transport, childcare or training, their opportunities may be limited.
It can also affect firms. If many households have low disposable income, demand for some goods and services may be weaker. Local businesses in poorer areas may find it harder to grow.
However, if rewards for effort and enterprise are reduced too much, some people may have less incentive to work extra hours, gain qualifications, start a business or invest.
Redistribution through taxation and government spending
Redistribution means government action to change the distribution of income and wealth, usually to reduce inequality.
Redistribution
Redistribution is when the government uses taxation and spending to transfer resources from some groups to others, often from higher-income households to lower-income households.
Taxation
A tax is a compulsory payment to the government.
A progressive tax takes a higher percentage of income as income rises. UK Income Tax is broadly progressive because higher earners pay higher rates on higher bands of income.
A regressive tax takes a larger proportion of income from lower-income households. Some indirect taxes, such as VAT, can be regressive because poorer households often spend a higher share of their income.
Taxation can redistribute income by:
- taxing higher incomes more heavily;
- taxing wealth, property or inheritance;
- using tax revenue to fund benefits and public services.
Thinking every tax reduces inequality
A tax is not automatically redistributive. A progressive income tax is more likely to reduce inequality than an indirect tax on everyday spending, because low-income households spend a larger share of their income.
Government spending
Government spending can redistribute income directly or indirectly.
Transfer payments are payments made by the government without receiving a good or service in return. Examples include Universal Credit, Child Benefit, disability benefits and the State Pension.
Public services are services funded or provided by the government, such as the NHS, state education, social care and public transport support. These may not increase someone’s cash income, but they can improve living standards and equality of opportunity.
Calculating the effect of tax and benefits
Redistribution often works by reducing the gap between market income and disposable income.
Calculating disposable income after tax and benefits
Household A has market income of £18,000, pays 5% in direct tax and receives £4,000 in benefits. Household B has market income of £90,000, pays 30% in direct tax and receives no benefits.
-
Calculate Household A’s tax:
0.05×£18,000=£9000.05 \times \pounds 18{,}000 = \pounds 9000.05×£18,000=£900.
Disposable income is £18,000−£900+£4,000=£21,100\pounds 18{,}000 - \pounds 900 + \pounds 4{,}000 = \pounds 21{,}100£18,000−£900+£4,000=£21,100. -
Calculate Household B’s tax:
0.30×£90,000=£27,0000.30 \times \pounds 90{,}000 = \pounds 27{,}0000.30×£90,000=£27,000.
Disposable income is £90,000−£27,000=£63,000\pounds 90{,}000 - \pounds 27{,}000 = \pounds 63{,}000£90,000−£27,000=£63,000. -
Compare the income gap before redistribution:
£90,000−£18,000=£72,000\pounds 90{,}000 - \pounds 18{,}000 = \pounds 72{,}000£90,000−£18,000=£72,000. -
Compare the income gap after redistribution:
£63,000−£21,100=£41,900\pounds 63{,}000 - \pounds 21{,}100 = \pounds 41{,}900£63,000−£21,100=£41,900.
The gap has fallen, so the distribution of disposable income is less unequal.
Consequences of redistribution policies
Redistribution has benefits, costs and trade-offs.
Possible benefits
Redistribution can reduce poverty and improve living standards. Benefits can help households afford essentials, while public services like education and healthcare can improve long-term opportunities.
For example, during the cost-of-living crisis, government support with energy bills and uprating some benefits helped protect vulnerable households from the full effect of higher prices.
Redistribution may also increase demand for goods and services because lower-income households are likely to spend a high proportion of any extra income.
Possible costs
Redistribution must be financed. Higher taxes may reduce incentives to work, save or invest if people feel they keep too little of extra income. Firms may also be affected if taxes increase their costs.
Benefits can create difficult incentive effects if people lose support quickly when they earn more. This can make extra work feel less rewarding, although well-designed benefit systems try to reduce this problem.
Public spending also has an opportunity cost: money spent on benefits or services cannot be spent on something else, such as defence, transport or reducing government borrowing.
Evaluating redistribution fairly
A strong judgement depends on the design of the policy. A targeted benefit for low-income families may reduce poverty effectively, but it may be expensive to administer. A broad tax cut may be simple, but it may give money to households who do not need support.
Evaluation phrase to use
A useful judgement is: “The policy is most effective if it reduces poverty without creating large disincentives to work, and if the government can afford it without cutting important services elsewhere.”
In the exam
-
Define your key terms clearly: income, wealth, inequality, redistribution, taxation and government spending.
-
Apply your answer to a real UK context, such as the 2022–23 cost-of-living squeeze, COVID-19 support, minimum-wage rises, benefits or progressive income tax.
-
Evaluate using trade-offs: fairness versus incentives, short run versus long run, winners versus losers, and the opportunity cost of government spending.
Check yourself
- What is the difference between income inequality and wealth inequality?
- Why is disposable income usually less unequal than market income?
- Give one benefit and one drawback of using progressive taxation to redistribute income.
