Question 13
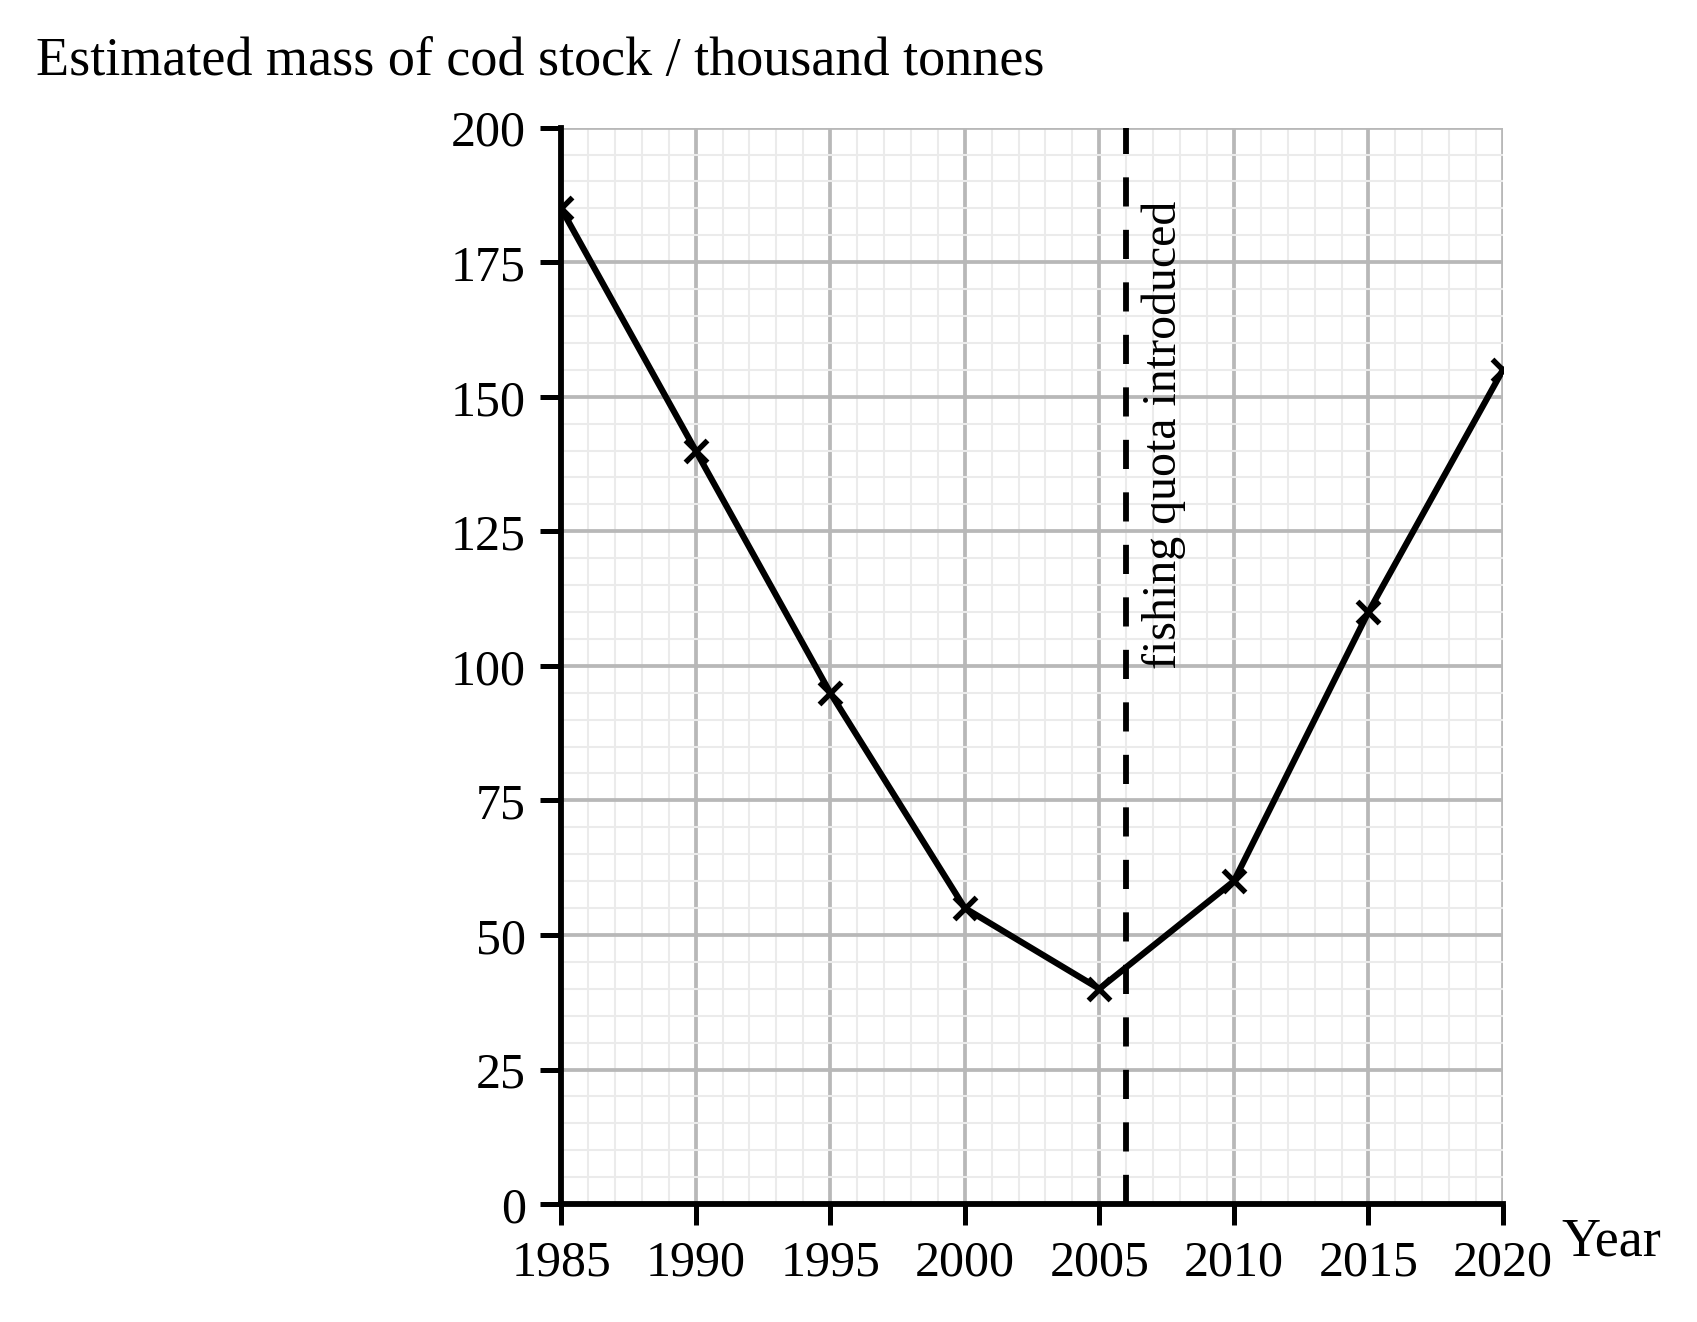
HThe figure shows the estimated mass of the cod stock in one area of the North Sea between 1985 and 2020. A fishing quota was introduced in this area in 2006.
Figure: The estimated mass of the cod stock in one area of the North Sea between 1985 and 2020
a.[3]
Describe how the estimated mass of the cod stock changed between 1985 and 2020. Use data from the figure.
b.[2]
Calculate the mean rate of change in the mass of the cod stock between 2005 and 2020. Give your answer in thousand tonnes per year.
c.[3]
A newspaper claims that the figure proves that the fishing quota caused the cod stock to recover.
Evaluate this claim.
7.5 Food production Questions
39 exam-style questions on AQA GCSE Biology 7.5 Food production, covering 7.5.1 Factors affecting food security, 7.5.2 Farming techniques, 7.5.3 Sustainable fisheries, and 7.5.4 Role of biotechnology. Each one has a worked solution and a mark scheme showing where the marks go.