Straight Line Graphs for a GCSE Maths Resit
Straight line graphs GCSE maths resit revision made clear. Learn how to plot lines, use y = mx + c and avoid mistakes that can cost a grade 4.
A GCSE Maths resit can feel unusually personal. You have seen the exam before, and now every topic seems to carry the weight of what happened last time. But straight line graphs offer a useful reset: the rules are stable, the method is repeatable, and careful working can earn marks.
For straight line graphs GCSE maths resit questions, focus on three skills: completing a table of values, plotting coordinates accurately and understanding the equation y=mx+cy=mx+cy=mx+c. These skills regularly connect algebra, coordinates and graphs, so learning them well can help elsewhere too.
Your straight line graphs checklist
Before moving on, aim to be able to:
- substitute values of xxx into a linear equation
- plot coordinates in the correct order
- draw one straight line through accurately plotted points
- recognise the gradient and yyy-intercept in y=mx+cy=mx+cy=mx+c
- find a gradient using change in yyy divided by change in xxx
- check whether an answer is sensible from the direction of the line
If drawing graphs is the main gap, begin with the Drawing Linear Graphs GCSE lesson. The accompanying linear graphs exam booklet gives you space to practise the process rather than merely read about it. AQA students can use the equivalent AQA Drawing Linear Graphs resources.
The idea behind a straight line graph
A straight line graph shows a relationship in which the rate of change remains constant. In the equation
y=mx+c,y=mx+c,y=mx+c,mmm is the gradient and ccc is the yyy-intercept.
The gradient describes the change in yyy for each increase of 111 in xxx. A positive gradient rises from left to right. A negative gradient falls from left to right. If m=0m=0m=0, the line is horizontal.
The yyy-intercept is where the line crosses the yyy-axis. Because every point on the yyy-axis has x=0x=0x=0, substituting x=0x=0x=0 gives
y=m(0)+c=c.y=m(0)+c=c.y=m(0)+c=c.So the line crosses the yyy-axis at (0,c)(0,c)(0,c). That small fact is also an effective check. If your graph of y=2x+3y=2x+3y=2x+3 does not cross at (0,3)(0,3)(0,3), something has gone wrong.
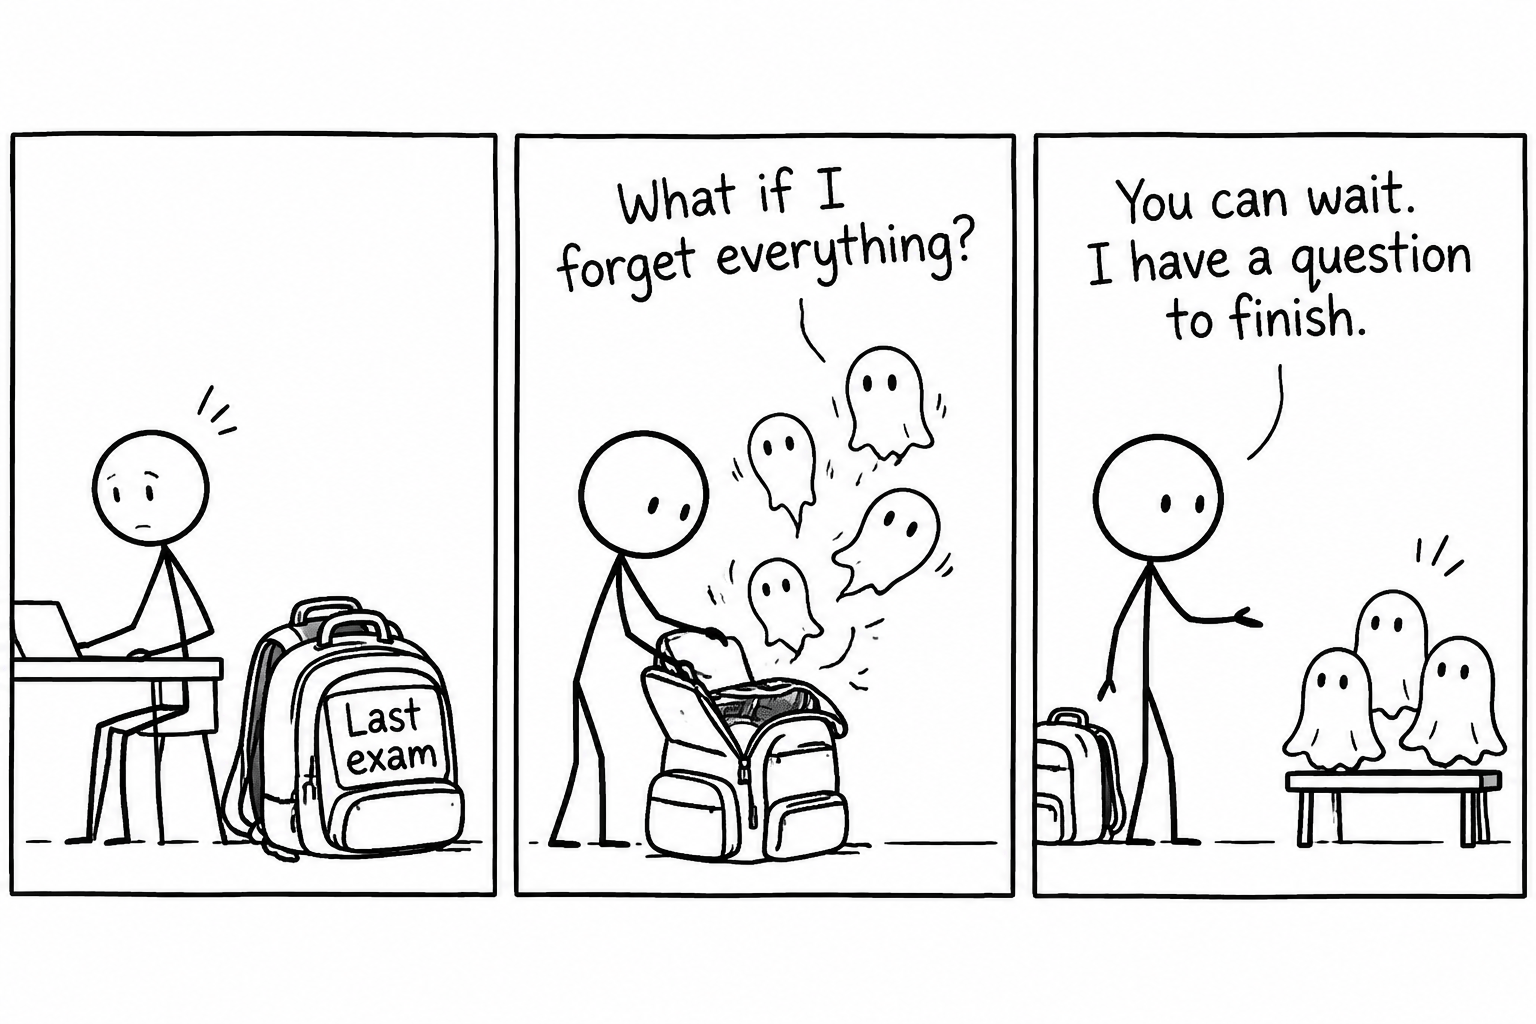 A resit student gives old exam worries a waiting-room bench before returning to the question
Worked example: drawing a straight line
Draw the graph of
y=2x−1y=2x-1y=2x−1for values of xxx from −2-2−2 to 222.
First, create a table and substitute each value of xxx. Keep negative values in brackets so that signs are easier to follow.
For x=−2x=-2x=−2:
y=2(−2)−1=−4−1=−5y=2(-2)-1=-4-1=-5y=2(−2)−1=−4−1=−5For x=−1x=-1x=−1:
y=2(−1)−1=−2−1=−3y=2(-1)-1=-2-1=-3y=2(−1)−1=−2−1=−3For x=0x=0x=0:
y=2(0)−1=−1y=2(0)-1=-1y=2(0)−1=−1For x=1x=1x=1:
y=2(1)−1=1y=2(1)-1=1y=2(1)−1=1For x=2x=2x=2:
y=2(2)−1=3y=2(2)-1=3y=2(2)−1=3| xxx | −2-2−2 | −1-1−1 | 000 | 111 | 222 |
|---|---|---|---|---|---|
| yyy | −5-5−5 | −3-3−3 | −1-1−1 | 111 | 333 |
Plot the coordinates (−2,−5)(-2,-5)(−2,−5), (−1,−3)(-1,-3)(−1,−3), (0,−1)(0,-1)(0,−1), (1,1)(1,1)(1,1) and (2,3)(2,3)(2,3). Then use a ruler to draw one straight line through them.
Two checks make this method safer. The equation has gradient 222, so the graph should rise by 222 whenever xxx increases by 111. It also has c=−1c=-1c=−1, so it should cross the yyy-axis at (0,−1)(0,-1)(0,−1). Both checks agree with the table.
During GCSE maths resit revision, repeat this process until substitution, plotting and checking feel like one routine. The goal is not speed at first. Reliable speed arrives after accurate repetition.
Worked example: finding a line's equation
A straight line passes through (1,5)(1,5)(1,5) and (4,11)(4,11)(4,11). Find its equation in the form y=mx+cy=mx+cy=mx+c.
Calculate the gradient using
m=change in ychange in x.m=\frac{\text{change in }y}{\text{change in }x}.m=change in xchange in y.Using the two coordinates:
m=11−54−1=63=2.m=\frac{11-5}{4-1}=\frac{6}{3}=2.m=4−111−5=36=2.The equation therefore begins
y=2x+c.y=2x+c.y=2x+c.Substitute one known point. Using (1,5)(1,5)(1,5) means x=1x=1x=1 and y=5y=5y=5:
5=2(1)+c5=2(1)+c5=2(1)+c 5=2+c5=2+c5=2+c c=3.c=3.c=3.The equation is
y=2x+3.y=2x+3.y=2x+3.Check it with the other point, (4,11)(4,11)(4,11):
2(4)+3=11.2(4)+3=11.2(4)+3=11.The result matches its yyy-coordinate, so the equation is consistent with both points.
This is a useful straight line graphs grade 4 routine: find mmm, substitute a point to find ccc, then check with the unused point. It creates evidence at every stage, which is much safer than guessing the intercept from an imperfect sketch.
How to practise for a grade 4
A grade is determined by performance across the whole qualification, not by mastering one isolated topic. Grade boundaries also vary by exam series and paper. Treat straight line graphs as one dependable part of a broader foundation revision plan rather than a promise of a particular result.
Start with a short revision lesson, then answer questions without looking at the method. Mark them promptly. A wrong answer is useful when you identify its cause: substitution, signs, plotting, scale or misunderstanding mmm and ccc.
Next, revisit the same skill after a gap. MathsGenie's Edexcel GCSE Maths revision hub brings together topic resources, past papers, mark schemes and practice materials. Past papers matter because they make you choose the method without being told the topic first. Video solutions, mini tests and predicted papers can then support the move from isolated practice to exam readiness.
Mistakes that cost marks
Reversing the coordinates
The coordinate (3,−2)(3,-2)(3,−2) means move to x=3x=3x=3 first, then to y=−2y=-2y=−2. Plotting (−2,3)(-2,3)(−2,3) puts the point somewhere entirely different. Quietly say “across, then up or down” as you plot.
Mishandling negative substitution
For y=3x+1y=3x+1y=3x+1 when x=−2x=-2x=−2, write
y=3(−2)+1=−6+1=−5.y=3(-2)+1=-6+1=-5.y=3(−2)+1=−6+1=−5.Brackets make the negative input visible and reduce avoidable sign errors.
Using the wrong gradient calculation
Gradient is
change in ychange in x,\frac{\text{change in }y}{\text{change in }x},change in xchange in y,not the other way round. Whichever point you begin with, subtract in the same order on the top and bottom.
Treating ccc as an xxx-intercept
In y=mx+cy=mx+cy=mx+c, ccc is the yyy-intercept. The line y=−3x+4y=-3x+4y=−3x+4 crosses the yyy-axis at (0,4)(0,4)(0,4).
Joining dots freehand
Unless instructed otherwise, use a ruler and draw a single straight line. Do not connect points with several short segments, and do not force a line through a point you suspect is incorrect. Recheck that coordinate first.
Ignoring the scale
An axis may increase in 111s, 222s, 555s or decimals. Read two labelled values and work out the value represented by each small square before plotting.
Make this a topic you can trust
Straight line graphs become manageable when you stop treating each question as new. A table question is substitution followed by plotting. An equation question is gradient followed by intercept. A graph-reading question begins with the scale.
That predictability is valuable in a resit. You are not trying to erase the previous exam; you are building routines that hold up under pressure. Use MathsGenie's free revision lessons, practice questions, mark schemes and video solutions to repair the precise step that is costing marks. Then use the revision planner to keep graph practice alongside number, algebra, ratio and geometry.
When the method feels secure, build a targeted practice paper in Mock Exam Builder. Include straight line graphs and the other topics highlighted by your recent marking. Complete it under timed conditions, mark it carefully, and turn every mistake into the next item on your revision list.