What you'll learn
- How sociologists describe patterns in health and illness across social groups.
- The five key explanations: artefact, self-selection, cultural, material, and access/provision of healthcare.
- How to apply these explanations to UK evidence such as ONS statistics, the NHS, Covid-19, and the Marmot Reviews.
- How to evaluate explanations in an essay using AO1, AO2 and AO3.
1. Start with the pattern: health is socially distributed
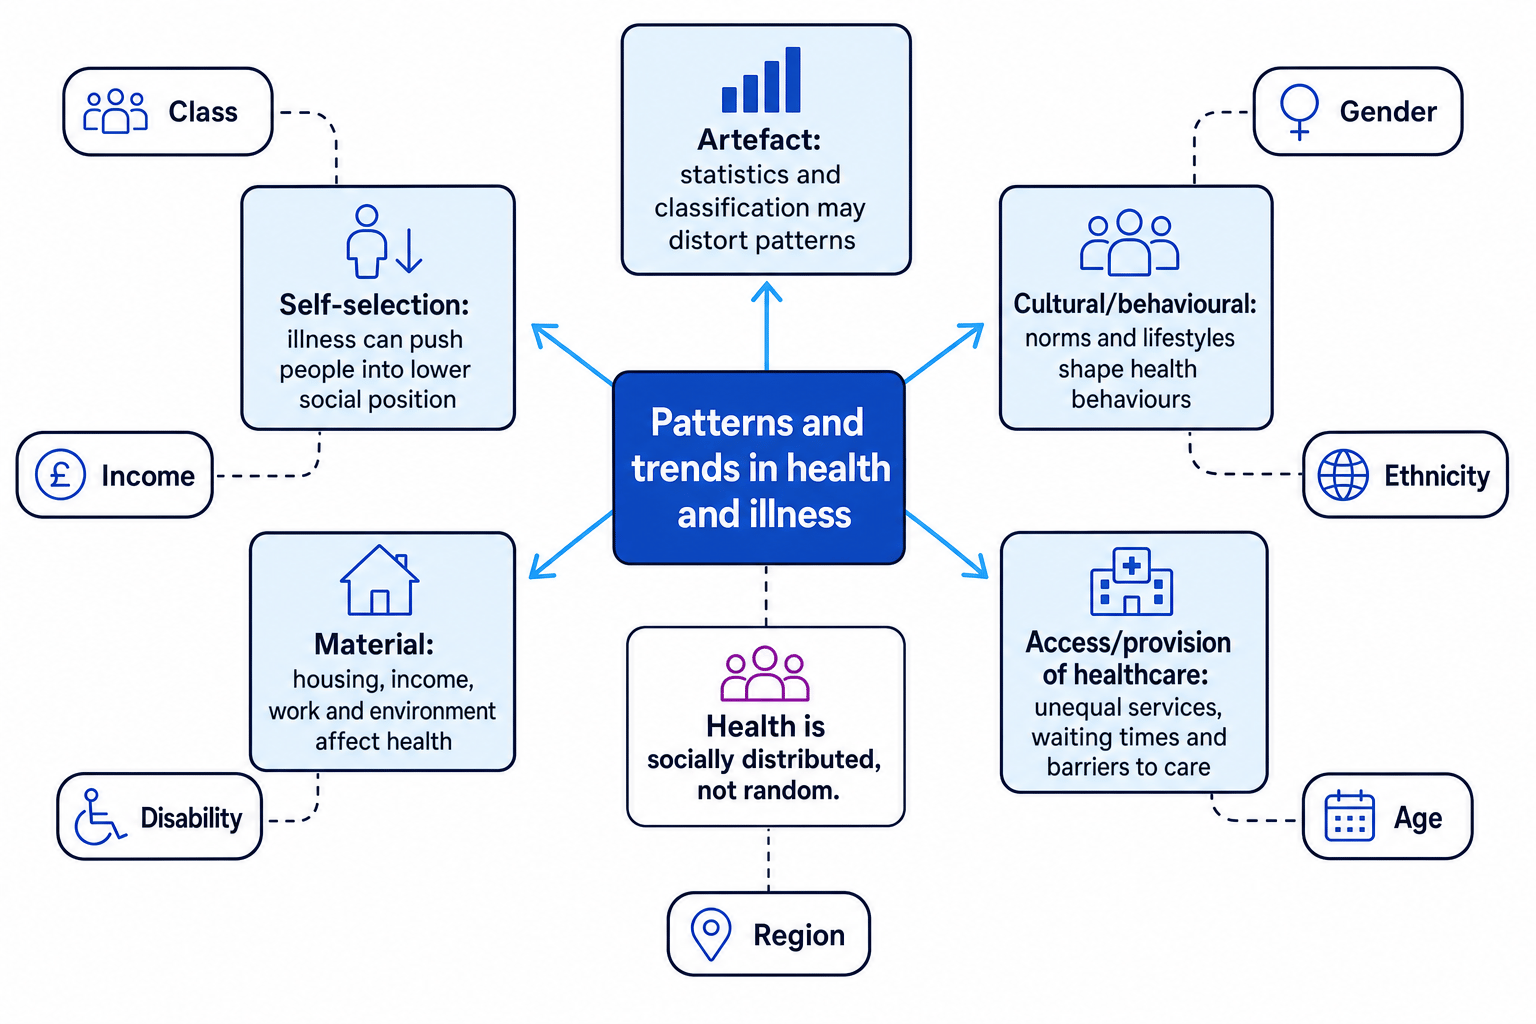
Sociologists are interested in the fact that health is not randomly distributed. In the UK, people’s chances of illness, recovery and early death vary by social class, income, gender, ethnicity, age, region and disability.
Health inequalities
Health inequalities are systematic differences in health outcomes between social groups. Key outcomes include morbidity — rates of illness — mortality — rates of death — and life expectancy — the average number of years people are expected to live.
A major pattern is the social gradient in health: health tends to improve at each step up the class or income hierarchy. The Black Report (1980), Acheson Report (1998), and Marmot Reviews (2010; 2020) all found that poorer groups experience worse health overall.
This matters for the cross-cutting theme of power and stratification: health reflects unequal life chances, not just biology. It also links to culture and identity, because health behaviours and access to services are shaped by socialisation, community norms and trust in institutions.
The big sociological point
A strong answer does not treat illness as simply individual choice. It asks how social position shapes exposure to risk, resources for recovery, and the way health data are recorded.
2. Artefact explanation: are the statistics misleading?
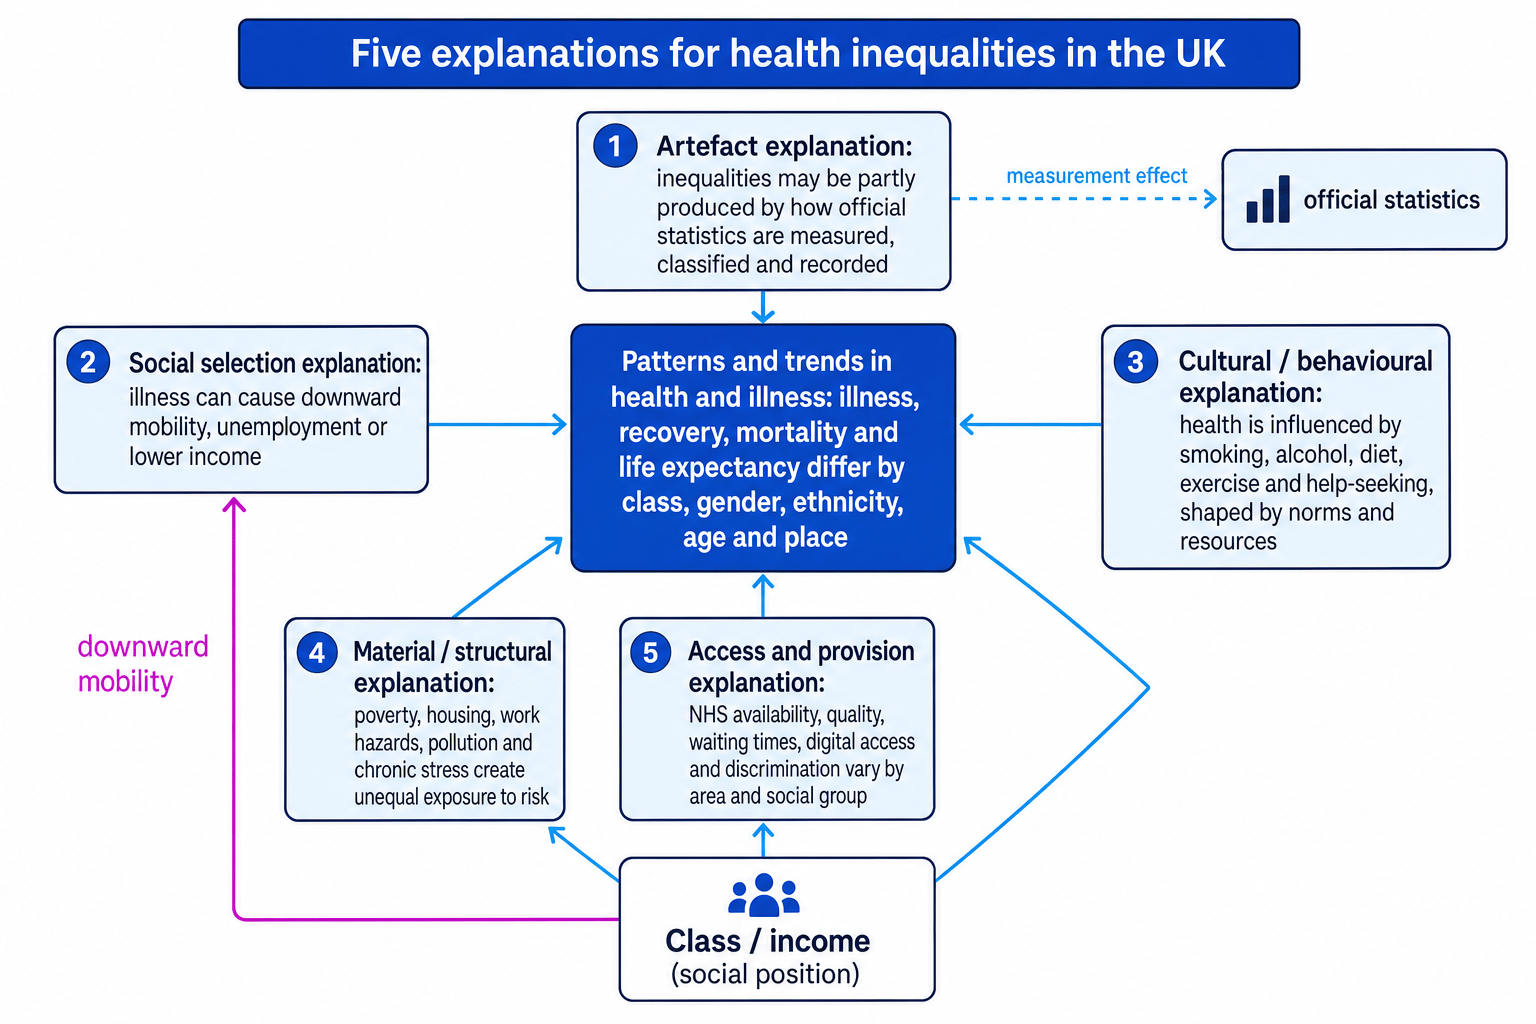
The artefact explanation argues that some apparent health inequalities may be created or exaggerated by the way official statistics are collected, classified and interpreted.
For example, class categories often rely on occupation. This can be awkward for retired people, unemployed people, unpaid carers, students, or people with unstable work. Ethnic categories can also change over time, making trend comparisons difficult. Some illnesses are underdiagnosed if people are less likely to visit a GP or receive screening.
This explanation is useful because it reminds you that official statistics are not “pure facts”; they are socially produced. Positivist researchers may value ONS and NHS data for reliability and large-scale coverage, but sociologists still need to ask whether categories are valid.
However, the Black Report considered the artefact explanation and rejected it as a full explanation. Inequalities appear across many different measures, including mortality, infant mortality, healthy life expectancy and long-term illness. Artefact issues may affect the size of inequalities, but they rarely make the pattern disappear.
Checking whether a class gap is an artefact
- If manual workers have higher recorded mortality, first ask whether the comparison controls for age, because older groups naturally have higher death rates.
- Then check how class was measured: occupational class may miss retired people, unemployed people and unpaid domestic labour.
- If the gap remains across age-adjusted data, deprivation measures and several health outcomes, conclude that artefact may distort the figures but is unlikely to explain the whole inequality.
Artefact does not mean imaginary illness
Do not write that health inequalities are “fake”. The artefact explanation says measurement may partly shape the pattern, not that people are not really ill.
3. Self-selection: does illness cause low social position?
Self-selection, also called health selection, argues that poor health can push people down the social hierarchy. In this view, the direction of causation is partly reversed: instead of poverty causing illness, illness can cause poverty.
For example, a person with a long-term condition may miss school, leave work, reduce hours, lose income, or become dependent on benefits. Mental illness can also contribute to unemployment or downward mobility. This explanation is especially relevant when discussing disability, because social barriers and workplace discrimination can turn impairment into economic disadvantage.
Its strength is that it explains why some people move into lower-income groups after illness. But it is weaker as a general explanation because many health inequalities appear very early in life, before adult occupation can have an effect. It also risks blaming sick or disabled people for their social position, rather than analysing structural barriers.
Separating selection from structural causation
- Suppose someone develops a chronic illness, leaves full-time work and then moves into a lower-income household. That supports a health-selection pathway.
- Now ask what came first: if they already lived in poor housing or experienced childhood deprivation before illness, material factors are also likely.
- A balanced judgement would say self-selection explains some downward mobility, but not the wider social gradient in health.
4. Cultural and behavioural explanations
A cultural explanation focuses on values, norms and lifestyles that affect health. A health behaviour is an action that influences health, such as smoking, diet, alcohol use, exercise, sleep, vaccination or seeking medical help.
This explanation suggests that some groups experience worse health because they are more likely to adopt risky behaviours. For example, smoking rates are higher in more deprived groups, and diet may be shaped by family habits, peer groups and ideas about masculinity or femininity.
But culture is not just “choice”. Bourdieu’s idea of habitus helps here: people’s tastes and habits are shaped by their social background. Graham’s research on women and smoking showed that smoking could be understood as a coping strategy under conditions of poverty and stress, not simply ignorance.
Policies such as smoking bans, sugar taxes, vaccination campaigns and public health education often draw on behavioural explanations. Their weakness is that they can become victim-blaming if they ignore low income, insecure work, food prices, advertising and local environments.
Applying a cultural explanation to smoking
- Start with the pattern: smoking is more common in lower-income groups, so it may contribute to class differences in illness.
- Apply culture carefully: smoking may be normalised in friendship networks or used to manage stress, so behaviour is socially shaped.
- Evaluate it by linking to material conditions: advice to quit is less effective if poverty, stress and poor housing remain unchanged.
5. Material explanations: unequal living conditions
A material explanation argues that health inequalities are caused mainly by unequal access to money, housing, safe work, education, transport, food and clean environments.
This was the strongest explanation in the Black Report and remains central in Marmot’s work on the social determinants of health: the conditions in which people are born, grow, live, work and age. Deprived groups are more likely to experience damp housing, pollution, insecure employment, occupational hazards, debt, poor nutrition and chronic stress.
This is a conflict-based explanation because it links health to unequal power and resources. Marxist and neo-Marxist approaches would stress how capitalism distributes risk unequally: some groups profit from poor-quality housing, low-paid work or unhealthy products, while poorer groups carry the health costs.
The strength of the material explanation is that it explains the social gradient very well. Its limitation is that it may underplay agency and cultural meanings: not everyone in the same material position behaves the same way or has the same health outcome.
Explaining respiratory illness through material conditions
- Imagine a child living in overcrowded, damp housing near a busy road. These conditions increase exposure to mould, stress and air pollution.
- Link this to the outcome: asthma or respiratory illness becomes more likely because the child faces greater environmental risk.
- Evaluate by adding culture and access: family smoking habits or delayed GP appointments may worsen the problem, but the material environment is the starting point.
6. Inequalities in access to and provision of healthcare
Access means people’s ability to use healthcare when they need it. Provision means the amount and quality of healthcare available. The NHS is free at the point of use, but this does not mean access is equal.
Tudor Hart’s inverse care law (1971) argues that the availability of good medical care tends to be lowest where need is greatest. In the UK, this can appear through GP shortages, long waiting lists, transport difficulties, digital exclusion, language barriers, inaccessible buildings, or distrust caused by past discrimination.
Examples include “postcode lotteries” in treatment availability, unequal access to NHS dentistry, lower screening uptake in some communities, and evidence that some ethnic minority patients report poorer experiences of healthcare. Gender also matters: women’s pain or symptoms have sometimes been dismissed, while men may delay help-seeking because of masculine norms.
Healthcare access is important, but it mainly explains what happens after someone becomes ill. It does not fully explain why illness begins in the first place. That is why it works best alongside material and cultural explanations.
Using the inverse care law
- Compare two patients with similar symptoms: one lives near several GP surgeries and has flexible work; the other has poor transport, insecure shifts and limited digital access.
- The second patient may delay diagnosis, miss appointments or wait longer for treatment, increasing the risk of worse outcomes.
- Apply Tudor Hart by arguing that healthcare provision may be least effective for groups with the greatest health needs.
7. Putting the explanations together in essays
The best essays compare explanations rather than listing them. A useful line of argument is:
- Artefact is a methodological warning: check how data are produced.
- Self-selection explains some downward mobility after illness.
- Cultural explanations identify behaviours that directly affect health.
- Material explanations explain why risky environments and stress are unequally distributed.
- Access/provision explanations show how treatment and recovery are also unequal.
Build AO3 into every paragraph
After explaining one cause, ask: “What does this explain well, what does it leave out, and which other explanation strengthens or challenges it?”
For methods evaluation, remember that ONS and NHS statistics are usually large-scale and reliable, but they may miss lived experience. Qualitative interviews can reveal meanings, stigma and barriers to access, but may be less representative. Ethical issues are important in health research because illness, disability and medical records are sensitive topics.
In the exam
- Start by identifying the pattern: class, ethnicity, gender, age, disability or region.
- Define the explanation clearly before applying it to a UK example.
- Use named evidence such as Black, Acheson, Marmot, Graham or Tudor Hart where relevant.
- Evaluate by comparing explanations: material factors often underpin culture and access, while artefact and self-selection are usually partial explanations.
- End with a judgement about which explanation, or combination, is most convincing.
Check yourself
- Why is the artefact explanation useful but limited?
- How can cultural explanations become victim-blaming?
- Why do many sociologists see material factors as central to health inequalities?