What you'll learn
- How sociologists use official statistics to identify health inequalities.
- The main patterns in health and illness by social class, gender, ethnicity and age.
- How to explain these patterns using ideas such as material deprivation, culture, social selection and racism.
- How to evaluate evidence for essay-style answers in Eduqas Component 3.
1. The starting point: health is socially patterned
Sociologists do not just ask “Who is ill?” They ask: which groups are more likely to become ill, die earlier, or experience poor access to healthcare — and why?
A pattern is a regular difference between social groups at a particular time. A trend is a change over time. For example, a class pattern might be that people in more deprived areas have worse health; a trend might be that improvements in life expectancy have slowed since the 2010s.
Key health terms
Morbidity means levels of illness or disease in a population. Mortality means deaths in a population. Life expectancy is the average number of years someone is expected to live. Healthy life expectancy is the average number of years someone is expected to live in good health.
Health inequalities link directly to power and stratification because they show how resources such as income, safe housing, good work, education and healthcare are unequally distributed. They also link to culture and identity because ideas about masculinity, ageing, ethnicity and “healthy behaviour” shape how people understand illness and seek help.
The social gradient is one of the most important ideas: as deprivation increases, health outcomes usually worsen.
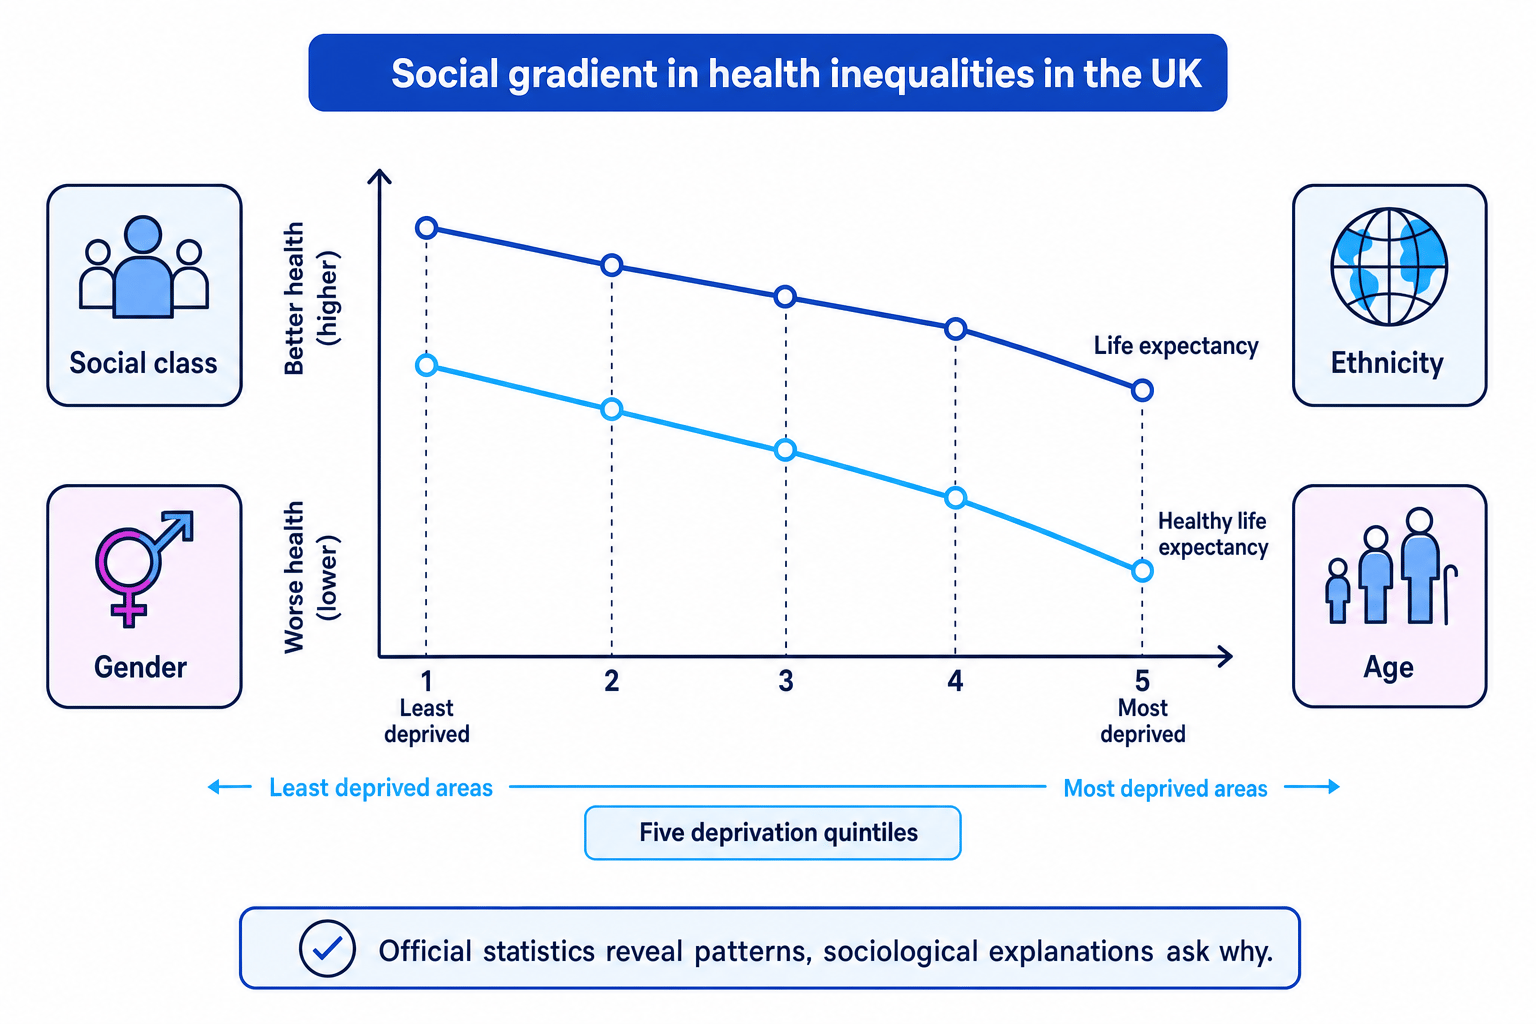
The social gradient
Health inequality is not only about the very poorest versus the very richest. It often appears as a gradient, where each step down the social hierarchy is associated with worse health.
2. Official statistics: what they are and why they matter
Official statistics
Official statistics are quantitative data collected or published by government bodies or public organisations, such as the Office for National Statistics, NHS Digital, the Census, public health profiles, mortality records and health surveys.
For this topic, useful sources include:
- ONS data on life expectancy, mortality, causes of death and Census health questions.
- NHS Digital / NHS England data on hospital admissions, diagnoses, waiting lists and mental health services.
- Health Survey for England data on health behaviours and self-reported health.
- Index of Multiple Deprivation data, which ranks areas by deprivation using indicators such as income, employment, education, housing and environment.
Official statistics are useful for sociology because they allow researchers to compare large groups and track trends over time. A positivist sociologist would value them because they are often large-scale, standardised and reliable.
However, they do not automatically explain why inequalities exist. They may miss hidden illness, rely on medical diagnosis, or reflect unequal access to doctors. Interpretivists would argue that official data often lacks meaning: it may not show how people experience pain, stigma, disability or medical treatment.
Interpreting an official-statistics item
Imagine an item says: “People in the most deprived areas have much lower healthy life expectancy than those in the least deprived areas. Women live longer than men but report more years in poor health.”
-
Identify the social divisions being compared: the item compares people by area deprivation and gender.
-
Identify the health outcomes: it refers to healthy life expectancy, overall life expectancy and self-reported poor health.
-
Apply sociological explanation: deprivation suggests a materialist explanation, such as poorer housing, insecure work, pollution and lower income. The gender pattern suggests a “gender paradox”: women tend to live longer, but may experience more years of illness or disability.
-
Evaluate the evidence: official statistics are strong for showing broad patterns, but self-reported health may vary by culture, age, willingness to disclose illness and access to diagnosis.
Describing without explaining
A weak answer says only “working-class people have worse health”. A stronger answer explains why this pattern may occur and evaluates whether the evidence proves the explanation.
3. Social class and deprivation
Social class refers to a person’s position in the social hierarchy, often linked to occupation, income, education and wealth. In official statistics, class may be measured through occupational categories such as the National Statistics Socio-economic Classification.
The main pattern is clear: people in lower social classes and more deprived areas tend to have worse health outcomes. They are more likely to experience chronic illness, disability, mental ill-health, infant mortality and premature death. They also tend to have lower healthy life expectancy.
The Black Report (1980) was a major UK study showing that health inequalities persisted despite the creation of the NHS. It argued that free healthcare alone cannot remove health inequalities if wider inequalities in income, housing and work remain. The Acheson Report (1998) and Marmot Review (2010; updated 2020) also emphasised the “social determinants of health” — the conditions in which people are born, grow, live, work and age.
Tudor Hart’s inverse care law (1971) is also useful: it suggests that those who need healthcare most are often least likely to receive the best access to it, especially in poorer areas.
The classic debate compares several explanations for class inequalities in health.
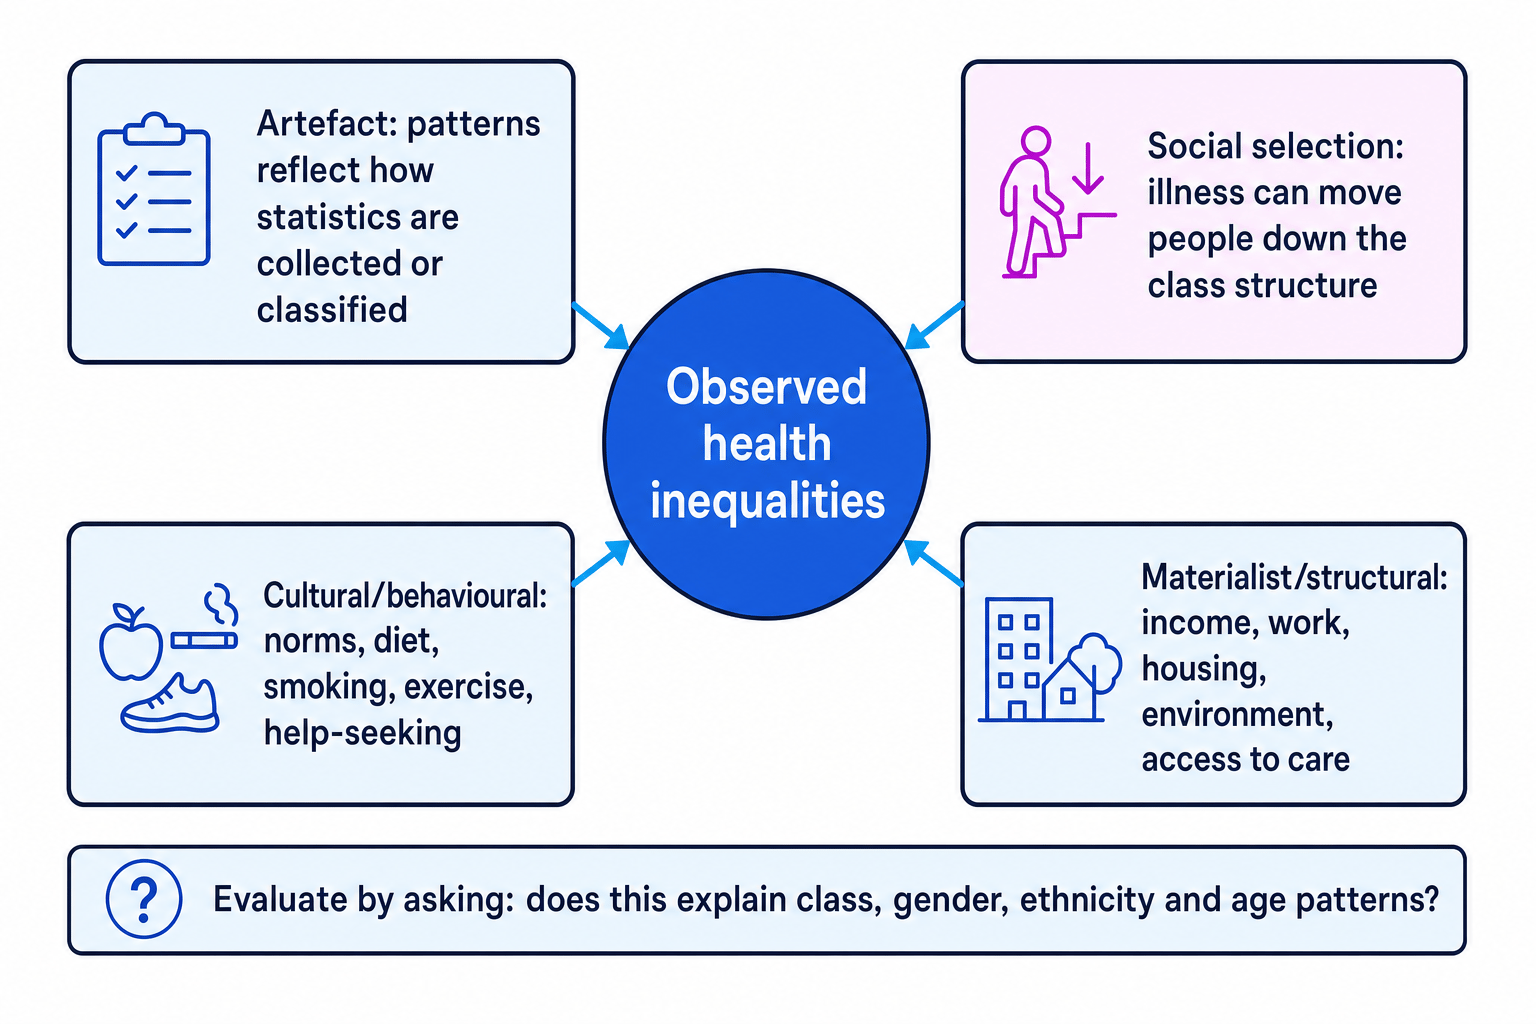
Materialist or structural explanations
A materialist explanation focuses on unequal resources and living conditions. Poor health may be linked to low income, damp housing, unsafe work, food insecurity, pollution, insecure employment and chronic stress.
This is powerful because it connects health to stratification. It also fits Marmot’s argument that health is shaped by social conditions across the life course.
Cultural or behavioural explanations
A cultural explanation focuses on health-related norms and behaviours, such as smoking, diet, exercise, alcohol use and help-seeking.
This can explain some differences, but it must be used carefully. Behaviour is not simply individual choice: choices are shaped by income, advertising, stress, education, work patterns and local environments.
Victim-blaming lifestyles
Do not write as if poorer groups are simply “choosing” to be unhealthy. A better answer asks how poverty and inequality limit realistic choices.
Social selection explanations
Social selection suggests that poor health can cause downward social mobility. For example, long-term illness may reduce someone’s ability to work, leading to lower income.
This is useful, but it does not fully explain why health problems are already more common in deprived areas.
Artefact explanations
An artefact explanation argues that health inequalities may partly reflect how data is collected, classified or measured. For example, occupational class statistics may exclude people not in paid work.
This is a useful methodological warning, but most sociologists argue it cannot explain away the scale and persistence of health inequalities.
Choosing between explanations
Suppose a source describes high asthma rates among children living near busy roads and in damp rented housing.
-
Link the health outcome to the social condition: asthma is connected to air pollution and poor-quality housing.
-
Select the strongest explanation: a materialist explanation fits best because the source focuses on living conditions, not just individual behaviour.
-
Add evaluation: cultural factors may still matter, such as whether families seek medical advice early, but those behaviours are shaped by access, income, language and trust in services.
4. Gender patterns in health and illness
Gender refers to socially constructed expectations about masculinity and femininity. It is different from biological sex, although the two are often linked in official data.
A common pattern is that women tend to have higher life expectancy than men, but often report more years in poor health. Men are more likely to experience premature death from causes such as accidents, heart disease and suicide. Women are more likely to use health services and report certain long-term conditions or mental health problems.
Sociologists explain this through socialisation and gender roles. Connell’s idea of hegemonic masculinity is useful: some masculine identities encourage risk-taking, heavy drinking, dangerous work, emotional control and reluctance to seek help. This can help explain men’s lower use of some health services and higher suicide risk.
Feminist approaches add that women’s health is shaped by unpaid caring work, low pay, domestic violence, reproductive health, and sometimes the medicalisation of women’s bodies. Doyal argued that women’s health cannot be understood without examining patriarchy and economic inequality.
AO3 evaluation: gender patterns are not the same for everyone. A middle-class woman, a working-class man, and an older Black woman may face very different risks. This is where intersectionality matters: social divisions combine rather than operate separately.
5. Ethnicity patterns in health and illness
Ethnicity refers to shared cultural heritage, identity, language, religion or ancestry. It should not be treated as a simple biological cause of illness.
Ethnic patterns in health are complex. Some minority ethnic groups have higher rates of particular conditions, such as diabetes among some South Asian groups. Black women in the UK face much higher maternal mortality risks than White women. During the early stages of COVID-19, several minority ethnic groups had higher mortality risks, linked to factors such as front-line work, overcrowded housing, deprivation and pre-existing health inequalities.
A strong sociological answer should consider:
- Class and deprivation: minority ethnic groups are more likely to experience poverty, insecure work or overcrowded housing.
- Racism and discrimination: racism can affect employment, housing, stress levels and treatment within healthcare.
- Healthcare access: language barriers, mistrust, implicit bias and unequal diagnosis can shape outcomes.
- Culture and identity: diet, religion and family practices may matter, but should not be used as a simplistic explanation.
Treating ethnicity as biology
Avoid writing “ethnicity causes illness”. Instead, ask how racism, deprivation, migration history, age profile, culture and healthcare access shape health outcomes.
Methodologically, ethnic categories in official statistics can be too broad. For example, “Asian” may hide differences between Indian, Pakistani, Bangladeshi and Chinese communities. Age structure also matters: some ethnic groups have younger populations, so raw death rates can be misleading unless researchers compare like with like.
6. Age patterns in health and illness
Age is one of the most obvious patterns in health, but it still needs sociological explanation. Older people are more likely to experience chronic illness, disability, dementia and multiple health conditions. An ageing population increases pressure on the NHS and social care.
However, age is not only biological. A life-course approach looks at how advantages and disadvantages build up over time. Poor childhood housing, low income, insecure work and stress can affect health decades later. This links strongly to Marmot’s argument that giving every child the best start is a health policy issue, not just an education or family policy issue.
There are also important trends among younger people, including rising concern about mental health, self-harm, eating disorders and long waiting times for support. Official statistics can show service demand, but they may also reflect greater awareness and willingness to seek help.
Age intersects with class, gender and ethnicity. For example, an older person in a deprived area may face poorer transport, fewer services, social isolation and lower healthy life expectancy than an older person in an affluent area.
Evaluation sentence stem
Use this structure: “Although the statistics show a pattern by ___, this should be interpreted alongside ___ because health inequalities are intersectional.”
7. Pulling it together for essays
For Eduqas essays, aim to combine:
- AO1: accurate knowledge of concepts, studies and explanations, such as Black, Acheson, Marmot, Tudor Hart, materialist explanations and cultural explanations.
- AO2: application to contemporary UK examples, such as ONS life expectancy data, COVID-19 inequalities, Black maternal mortality, mental health service demand, or deprivation indices.
- AO3: evaluation of evidence and explanations, including whether statistics are valid, whether explanations blame individuals, and whether class, gender, ethnicity and age intersect.
The strongest answers do not list four separate groups and stop. They show how social divisions overlap and how health inequalities reveal wider inequalities in power, resources, identity and status.
In the exam
-
Start with the pattern: identify which social group has better or worse health outcomes, using terms such as mortality, morbidity or healthy life expectancy.
-
Explain the pattern sociologically: link it to material conditions, culture, socialisation, racism, gender roles, age or the life course.
-
Evaluate the evidence: question how official statistics were collected, whether categories are too broad, and how class, gender, ethnicity and age intersect.
Check yourself
- What is the difference between a health pattern and a health trend?
- Why might official statistics show strong reliability but still have problems with validity?
- How could a materialist explanation and a cultural explanation interpret the same class health inequality differently?
