What you'll learn
- How sociologists define social inequality, life chances and stratification.
- Key evidence of inequality by social class, gender, ethnicity and age in the contemporary UK.
- How inequalities overlap through intersectionality.
- How to turn evidence into AO1, AO2 and AO3 points for essay-style answers.
Starting point: what is social inequality?
Sociologists are interested in patterns. If one individual has a bad experience, that may be personal misfortune. If whole groups repeatedly have different chances of income, health, education, safety or power, sociologists call that social inequality.
Social inequality
Social inequality means patterned and unequal access to valued resources, opportunities and rewards in society, such as money, status, education, healthcare, housing and political influence.
A closely linked term is life chances. This was developed by Max Weber, who argued that people’s opportunities are shaped by their position in the social structure, not just by individual effort.
Life chances
Life chances are the opportunities people have to achieve desirable outcomes, such as good qualifications, secure employment, good health and a comfortable standard of living.
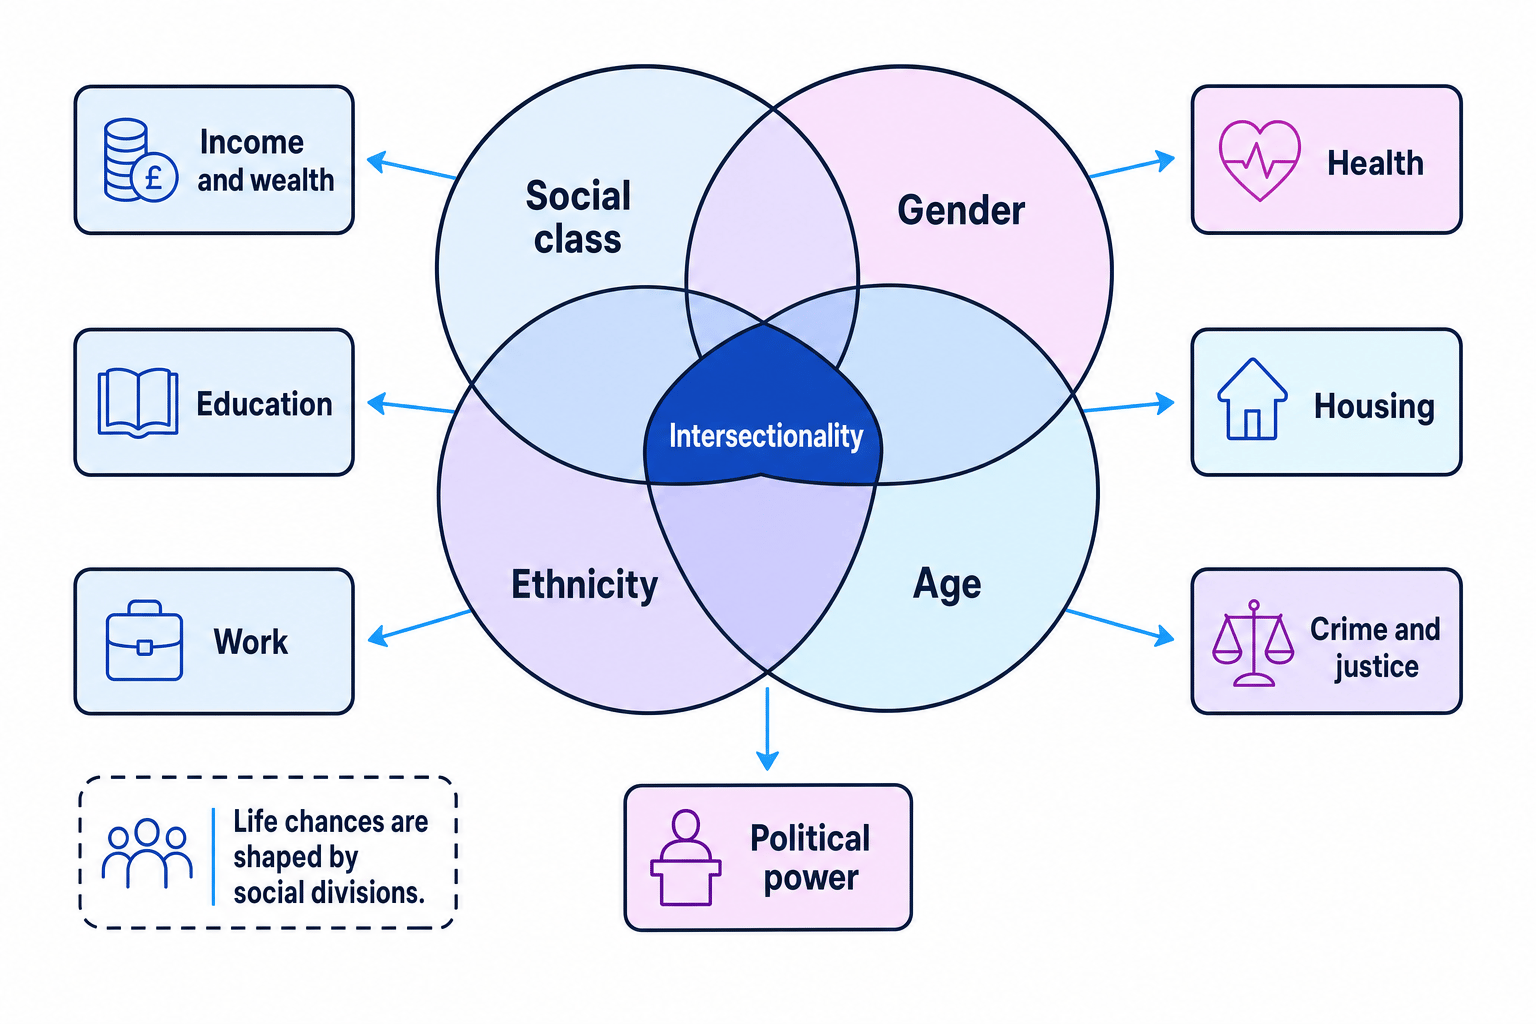
In this topic, you need evidence and examples of inequality linked to four major social divisions:
- Social class
- Gender
- Ethnicity
- Age
These divisions affect people across many areas of life, including education, work, income, health, housing, crime and political representation.
The big idea
Inequality is not just about “some people having more money”. It is about structured differences in power, resources, status and identity that shape people’s lives across institutions.
Social stratification: society as layers
Social stratification
Social stratification means the way society is organised into unequal layers or groups, with some groups having more wealth, power and status than others.
Different sociological perspectives explain stratification differently.
Marxist view
Karl Marx argued that capitalist societies are divided mainly by ownership of the means of production. The bourgeoisie, or capitalist class, own businesses, factories and capital. The proletariat, or working class, sell their labour for wages.
From this view, class inequality is built into capitalism because employers seek profit by paying workers less than the value of what they produce.
Weberian view
Weber agreed that class matters, but he argued inequality is also shaped by status and party.
- Class: economic position, such as income, wealth and market situation.
- Status: social honour or prestige.
- Party: organised power, such as political parties, unions or pressure groups.
This is useful for contemporary UK society because people may be advantaged in one way but disadvantaged in another. For example, some graduate professionals may have high cultural status but insecure employment or limited wealth.
Functionalist view
Functionalists such as Davis and Moore argued that inequality can be useful because it motivates people to train for important roles. Higher rewards are seen as encouraging people to become doctors, judges or engineers.
AO3 evaluation: this view is often criticised for ignoring inherited privilege. Many high rewards do not simply reflect talent or effort; they may reflect private education, family wealth, social networks and discrimination.
Writing as if inequality is only individual
Avoid explaining inequality only through “hard work” or “bad choices”. In sociology, you need to show how social structures, institutions and cultural expectations shape opportunities.
Social class inequality
Social class
Social class refers to a person’s economic and social position, usually linked to occupation, income, wealth, education and lifestyle.
In the UK, social class is commonly measured through occupation, but this is imperfect. For example, the National Statistics Socio-economic Classification groups people by employment relations and job conditions. Sociologists may also look at wealth, education, housing and cultural capital.
Pierre Bourdieu is useful here. He argued that advantage is not only economic. Middle-class families often pass on:
- Economic capital: money and assets.
- Cultural capital: knowledge, tastes, language styles and qualifications valued by institutions.
- Social capital: useful networks and contacts.
Evidence of class inequality in the UK
Class inequality appears across several areas:
- Income and wealth: ONS data consistently shows large gaps in wealth ownership, especially property, savings and pensions.
- Education: pupils eligible for free school meals tend to achieve lower average outcomes than non-eligible pupils, although there are many individual exceptions.
- Health: people in more deprived areas have lower average life expectancy and spend more years in poor health.
- Housing: middle-class households are more likely to own property, while working-class households are more likely to rent or experience housing insecurity.
- Work: working-class people are more likely to be in low-paid, insecure or physically demanding work.
AO2 application: contemporary examples include food bank use, insecure work in the gig economy, regional inequality between parts of London and former industrial areas, and differences shown in the Index of Multiple Deprivation.
Using class evidence in an inequality paragraph
- Start with the pattern: working-class people are more likely to experience lower income, poorer housing and worse health outcomes than middle-class groups.
- Link the pattern to a sociological concept: Bourdieu would argue that middle-class families often transmit cultural and social capital, helping children succeed in education and employment.
- Apply it to the UK: for example, pupils from wealthier households may have access to private tutoring, stable housing, digital resources and parents familiar with university applications.
- Add evaluation: however, class does not determine outcomes completely; some working-class pupils succeed highly, and gender, ethnicity and region can alter class experiences.
Gender inequality
Gender
Gender refers to the socially constructed expectations, roles and identities associated with being female, male or another gender identity. It is different from biological sex, though society often links the two.
Feminist sociologists argue that the UK remains shaped by patriarchy, meaning a social system in which men hold disproportionate power.
Sylvia Walby identified different structures of patriarchy, including paid work, household labour, culture, sexuality, violence and the state. She argued patriarchy has changed rather than disappeared: women have gained legal rights, but inequalities remain.
Evidence of gender inequality in the UK
Gender inequality appears in several areas:
- Paid work: the gender pay gap persists, especially among older workers and parents.
- Unpaid labour: women still tend to do more childcare, housework and emotional labour.
- Power: women remain under-represented in some senior roles in politics, business and the judiciary.
- Violence and safety: women are disproportionately affected by domestic abuse, sexual harassment and fear of violence.
- Education: girls now often outperform boys in many educational measures, showing that inequality is not one-directional in every institution.
Policy examples include the Equal Pay Act 1970, now included in the Equality Act 2010, and gender pay gap reporting for larger employers. These show that the state recognises gender inequality, but legislation does not automatically remove it.
AO3 evaluation: some sociologists argue that women’s position has improved significantly through contraception, divorce reform, education and employment. Others argue that improvement is uneven, especially for working-class women, minority ethnic women, disabled women and lone parents.
Gender essays
Do not write “women are always disadvantaged and men are always advantaged” in a simple way. A stronger answer shows patterns, exceptions and intersections — for example, boys’ educational underachievement alongside women’s economic and safety inequalities.
Ethnic inequality
Ethnicity
Ethnicity refers to shared cultural identity, which may include ancestry, language, religion, nationality, history and traditions.
Ethnicity is not the same as “race”. Race is a socially constructed category based on physical differences that societies treat as meaningful. Sociologists use the idea of racialisation to describe how groups come to be seen and treated through racial meanings.
Evidence of ethnic inequality in the UK
Ethnic inequality varies between groups, so avoid treating all minority ethnic groups as the same.
Patterns include:
- Employment: some minority ethnic groups experience higher unemployment or lower pay, even when qualified.
- Education: achievement patterns differ significantly by group; some groups outperform the national average, while others face barriers.
- Criminal justice: Black people are disproportionately represented in stop and search and some parts of the criminal justice system.
- Health: Covid-19 highlighted unequal health risks linked to occupation, housing, deprivation and access to services.
- Housing: some minority ethnic households are more likely to live in overcrowded housing or deprived areas.
The Macpherson Report into the murder of Stephen Lawrence used the term institutional racism to describe racism built into the routines and culture of organisations, not just the attitudes of individuals.
Institutional racism
Institutional racism means discriminatory outcomes produced by the policies, practices or culture of institutions, even when individuals within them may not see themselves as racist.
AO2 examples include the Race Disparity Audit, debates around stop and search, unequal maternal mortality risks, and employment discrimination shown through field experiments where identical CVs receive different responses depending on ethnic-sounding names.
AO3 evaluation: official statistics are useful because they show broad patterns, but ethnic categories can be too broad. For example, “Asian” may hide differences between Indian, Pakistani, Bangladeshi and Chinese groups. Data can also miss mixed identities and changing self-identification.
Evaluating ethnic inequality evidence
- Use the evidence carefully: if statistics show different employment rates between ethnic groups, this suggests a patterned inequality that needs sociological explanation.
- Consider possible causes: discrimination, social class, residential segregation, school experiences, migration history and cultural capital may all contribute.
- Avoid overgeneralising: the category “minority ethnic” contains groups with very different average incomes, educational outcomes and experiences of racism.
- Evaluate the method: official statistics are reliable for spotting national patterns, but they may lack validity if categories are too broad or if people experience identity in more complex ways.
Age inequality
Age inequality
Age inequality means unequal treatment, opportunities or status linked to a person’s age or stage in the life course.
Age matters because societies attach expectations to different life stages: childhood, youth, adulthood and old age. Sociologists call this the life course, meaning the socially patterned journey through stages of life.
Inequality affecting young people
Young people may face:
- Lower wages through age-banded minimum wage rates.
- Insecure work and expensive housing.
- Student debt and difficulty entering the housing market.
- Negative media stereotypes, especially around crime, anti-social behaviour or “snowflake” labels.
Youth can also be shaped by class, gender and ethnicity. For example, a middle-class young person with parental support may experience university and early adulthood very differently from a working-class young person in insecure employment.
Inequality affecting older people
Older people may face:
- Ageism in employment and healthcare.
- Pensioner poverty, especially among older women and people without private pensions.
- Social isolation and digital exclusion.
- Health inequalities, with poorer older people more likely to experience disability and shorter healthy life expectancy.
However, AO3 evaluation matters: not all older people are disadvantaged. Some older homeowners have benefited from rising property values and occupational pensions. This has led to debates about intergenerational inequality, where younger adults may have fewer chances of home ownership than previous generations.
Age is not just biology
Age inequality is socially organised. Laws, workplaces, media stereotypes, pensions, education systems and housing markets all shape what different age groups can do.
Intersectionality: inequalities combine
Intersectionality
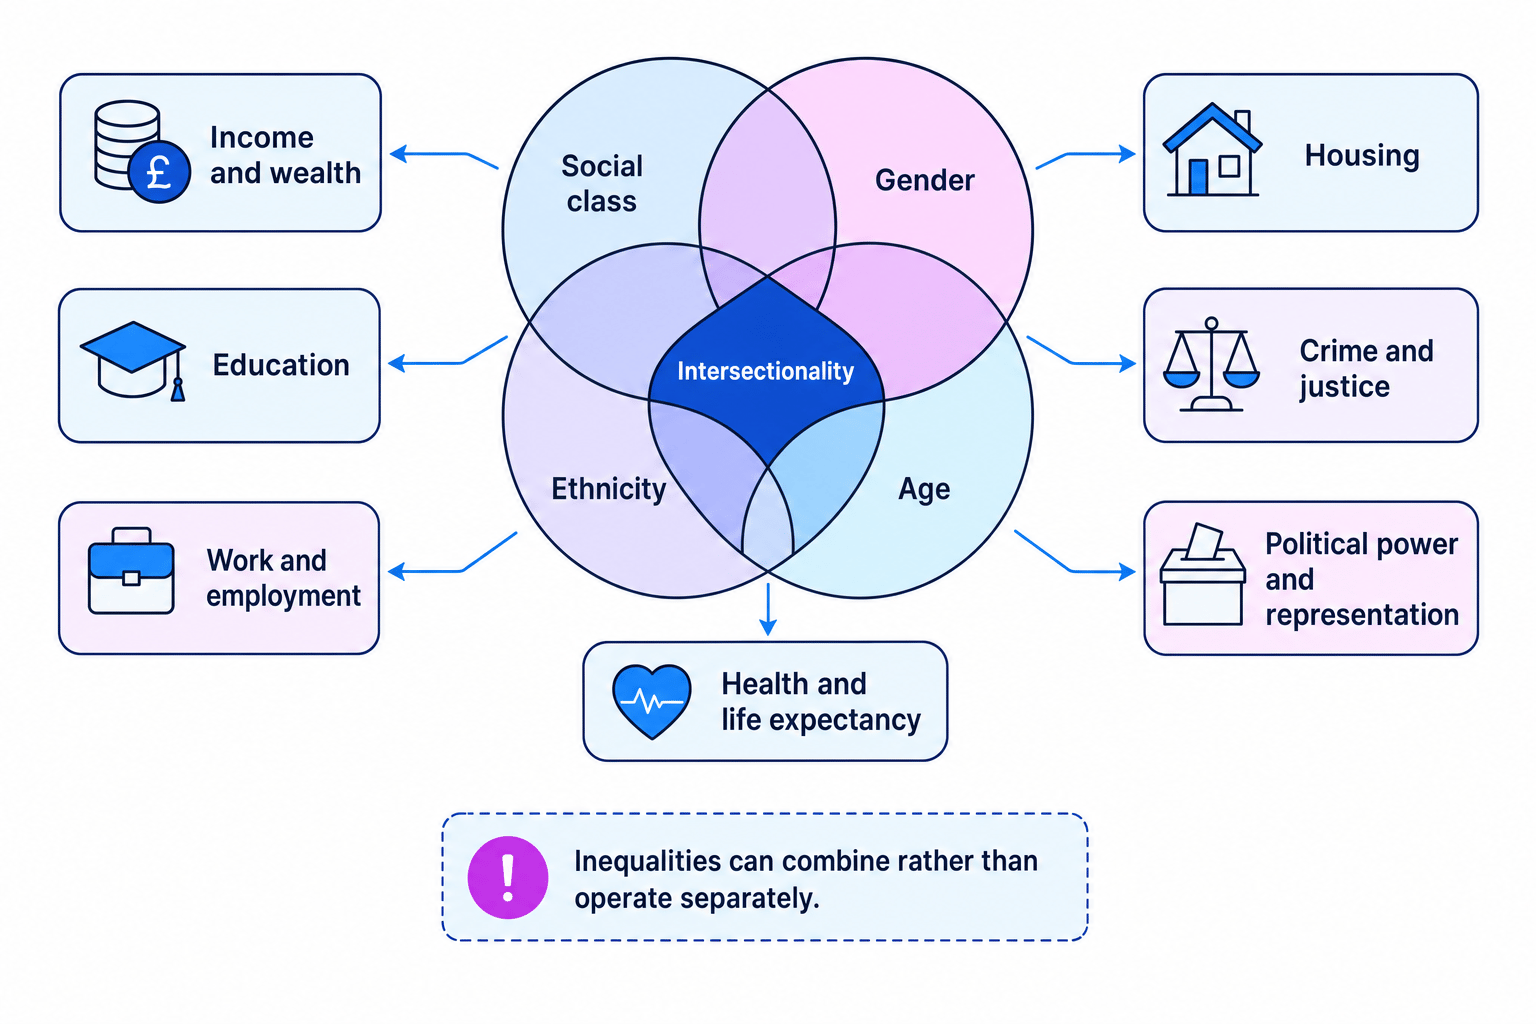
Intersectionality means the idea that social divisions such as class, gender, ethnicity, age, disability and sexuality interact, creating distinctive experiences of advantage and disadvantage.
The term is associated with Kimberlé Crenshaw, who argued that Black women’s experiences could not be fully understood by looking at gender or ethnicity separately.
In the UK, intersectionality helps you avoid flat comparisons. For example:
- A middle-class older man and a working-class older woman may experience ageing differently.
- A young Black man may experience policing differently from a young white woman.
- A Pakistani Muslim woman’s labour-market experiences may involve gender, ethnicity, religion and class at the same time.
- A wealthy woman may still face sexism, but her class position may protect her from some economic insecurity.
Applying intersectionality to a UK example
- Choose a concrete issue: overcrowded housing and health risks.
- Identify overlapping divisions: a low-income minority ethnic family may experience class inequality through poverty and ethnic inequality through discrimination or residential segregation.
- Add age: children in overcrowded housing may lack quiet study space, while older relatives may face health risks.
- Analyse the combined effect: the disadvantage is not simply “class plus ethnicity plus age” as separate boxes; the inequalities interact in everyday life.
- Evaluate: intersectionality gives a more valid picture of lived experience, but it can make broad statistical comparisons harder because groups become more specific.
Using evidence: official statistics and their limits
For this sub-topic, evidence often comes from official statistics such as the Census, ONS data, school performance data, crime statistics, health data and deprivation indices.
These are useful because they can show large-scale patterns across the UK. Positivist sociologists often value this kind of evidence because it is usually standardised and can be compared over time.
But there are limitations:
- Categories may be too broad.
- Some inequalities are hidden or under-reported, such as domestic abuse or hate crime.
- Statistics show correlation, but not always the lived meaning behind the numbers.
- Interpretivists would argue that interviews, ethnography and personal accounts can reveal how inequality is experienced.
Statistics without sociology
Do not just list facts such as “there is a pay gap” or “some groups have worse health”. Link the pattern to concepts like patriarchy, institutional racism, capitalism, cultural capital, ageism or life chances.
Pulling it together for essays
A strong answer on areas of inequality should do three things.
For AO1, define the social division and use sociological concepts or theorists. For example, class can be linked to Marx, Weber or Bourdieu; gender to feminism and Walby; ethnicity to institutional racism; age to ageism and the life course.
For AO2, apply the idea to contemporary UK examples. Use education, employment, housing, health, crime, income or representation.
For AO3, evaluate. You can compare perspectives, question evidence, point out social change, or use intersectionality to show that one division alone is not enough.
In the exam
- Make every paragraph do a job: concept or theory, UK evidence/example, then analysis or evaluation.
- Avoid treating class, gender, ethnicity and age as separate boxes only; add intersectionality where it strengthens your argument.
- Evaluate evidence carefully: official statistics are useful for patterns, but ask whether categories, under-reporting or lived experience complicate the picture.
Check yourself
- Can you explain the difference between social inequality, stratification and life chances?
- What is one UK example of inequality for each of class, gender, ethnicity and age?
- How could intersectionality improve an answer about inequality in contemporary Britain?