

What you'll learn
- How to approach practical work like a physicist: planning, testing, recording and evaluating.
- How to use equipment safely and choose methods that give reliable measurements.
- How to present observations, data, graphs and sources in a scientific way.
- How the practical endorsement skills also help you answer written-paper questions.
Why practical skills matter
Practical physics is not just “doing experiments”. It is the process of asking a testable question, collecting valid evidence, and deciding what the evidence actually supports.
In OCR A Physics, your practical work contributes to the Practical Endorsement, and your written exams can also test your understanding of practical methods, data handling, uncertainty, safety and evaluation.
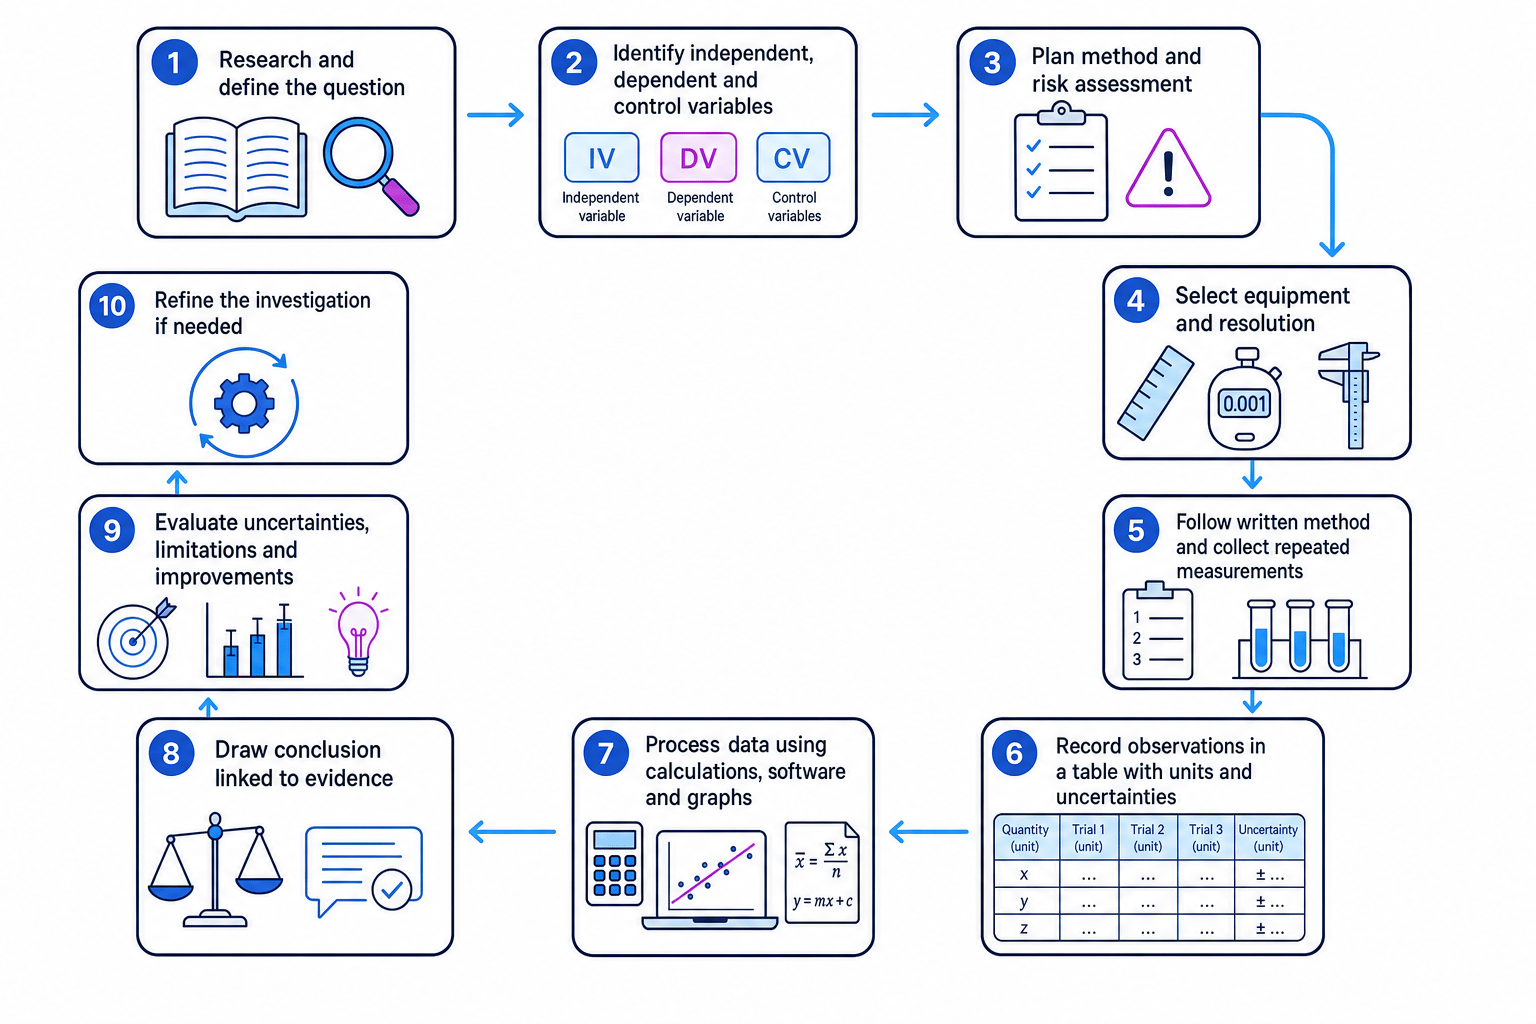
The practical cycle
A good investigation is a cycle: plan → measure → record → process → conclude → evaluate → improve. Each stage affects the reliability of the final conclusion.
Independent thinking: solving practical problems
Investigative approaches
An investigative approach means making sensible decisions during practical work rather than simply following a recipe blindly. You may need to decide what to measure, how many repeats to take, what range of values to use, or how to reduce uncertainty.
Variables
The independent variable is the quantity you deliberately change. The dependent variable is the quantity you measure in response. Control variables are quantities kept constant so the test is fair.
For example, if you investigate how the current through a filament lamp depends on potential difference, the independent variable is potential difference, the dependent variable is current, and control variables might include the same lamp and allowing time for readings to stabilise.
Planning a fair and useful investigation
A practical plan should usually include:
- the independent and dependent variables
- important control variables
- the equipment needed
- the range and interval of readings
- how repeats will be used
- how risks will be reduced
- how the data will be processed, for example by drawing a graph
Choosing variables for an investigation
You are asked to investigate how the extension of a spring depends on the force applied.
-
The quantity deliberately changed is the force on the spring, so the independent variable is force, measured in newtons, N.
-
The quantity measured in response is the extension of the spring, so the dependent variable is extension, measured in metres, m.
-
To make the test fair, you keep the same spring, use the same measurement position for length, and avoid exceeding the elastic limit of the spring.
-
A sensible method is to add masses gradually, record the spring length each time, calculate extension from final length minus original length, and plot force against extension or extension against force.
Changing more than one variable
If you change the spring and the mass at the same time, you cannot tell which change caused the new extension. A fair test changes only one independent variable at a time.
Safety and correct use of equipment
Hazards and risks
A hazard is something that could cause harm. A risk is the chance that the hazard actually causes harm, together with how serious the harm could be.
Risk assessment
A risk assessment identifies hazards, estimates the risk, and states control measures that reduce the risk to an acceptable level.
In A-Level Physics practicals, common hazards include:
- hot components, such as lamps or resistors
- electrical supplies and short circuits
- heavy masses falling
- springs or wires snapping
- lasers or bright light sources
- radioactive sources, if used under strict school procedures
- glassware, sharp edges, or moving objects
You are not expected to avoid all risk completely. You are expected to minimise risk sensibly.
Minimising risk
Control measures should be specific. “Be careful” is weak. Better examples include:
- place masses over a tray or cushion to reduce damage if they fall
- switch off the power supply before changing circuit connections
- use the lowest current that gives measurable readings
- keep eyes away from the line of a stretched wire or spring
- never look directly into a laser beam
- clamp apparatus securely before taking measurements
Reducing risk in a circuit practical
You are measuring the current through a resistor at different potential differences.
-
A possible hazard is that the resistor may become hot if the current is too large, because electrical energy is transferred thermally.
-
The risk is reduced by starting with a low potential difference and increasing it gradually, while checking that the current remains within the component’s rating.
-
The circuit should be switched off between readings if the component heats noticeably, because temperature changes can also affect resistance and reduce data quality.
Safety answers need a control measure
In exam questions, do not just name the hazard. Link it to an action: hot resistor → switch off between readings / allow to cool / limit current.
Following written instructions
Following written instructions means carrying out a method accurately and in the intended order. This includes setting up apparatus as shown, using the stated ranges, taking readings at the stated intervals, and recording any deviations.
This skill matters because a method is only repeatable if another person could follow it and obtain comparable results.
Repeatability and reproducibility
A result is repeatable if the same person using the same method and equipment obtains similar results. A result is reproducible if different people, methods or equipment obtain similar results.
If you need to change the method during a practical, record what changed and why. For example, if a light gate failed and you used a stopwatch instead, that affects the uncertainty and should be noted.
Making and recording observations and measurements
Observations versus measurements
An observation is something noticed during the experiment, such as “the filament glowed brighter” or “the oscillations became smaller”. A measurement is a numerical value with a unit, such as a length of 0.642 m or a current of 0.38 A.
Good practical records include both when relevant. Unexpected observations can explain anomalous results.
Units and resolution
The resolution of an instrument is the smallest change it can display or reliably measure. For example, a ruler marked in millimetres has a resolution of 1 mm, while a digital balance might have a resolution of 0.01 g.
Uncertainty
An uncertainty is an estimate of the range within which the true value of a measurement is likely to lie. It reflects limitations such as instrument resolution, judgement in reading a scale, and random variation.
For a single reading from a digital instrument, the uncertainty is often taken as about ± one smallest displayed division. For an analogue scale, it is often about ± half the smallest scale division, although judgement may be needed.
Recording a length with uncertainty
A ruler marked every 1 mm is used to measure the length of a wire. The measured length is 84.0 cm.
-
The ruler resolution is 1 mm, which is 0.1 cm.
-
For an analogue scale, a sensible reading uncertainty is about half the smallest division, so the uncertainty is ±0.5 mm, or ±0.05 cm.
-
The measurement can be recorded as length = 84.00 ± 0.05 cm, or length = 0.8400 ± 0.0005 m.
Forgetting the unit in a table heading
Do not write units repeatedly inside the body of a results table. Put them in the column heading, such as time / s or current / A.
Keeping appropriate records
A practical record should be clear enough that someone else could understand what you did later. It does not have to be beautiful, but it must be complete.
Include:
- date and title of the experiment
- aim or question being investigated
- labelled diagram or equipment list if useful
- method followed, including changes from written instructions
- risk assessment notes
- raw data table with units and uncertainties
- processed data, such as means, gradients or derived quantities
- graphs or software outputs
- conclusion and evaluation
Raw data is precious
Never overwrite raw readings with corrected or processed values. Keep the original data, then show any calculations separately.
Presenting information and data scientifically
Tables
A good results table has:
- quantity names and units in headings
- consistent decimal places for repeated readings
- repeats shown clearly
- mean values where appropriate
- uncertainty estimates where appropriate
- no unit-only entries in the data cells
For example, a column heading should be written as time / s in prose, not as “time” with “s” scattered down the column.
Graphs
Graphs are often the best way to reveal a relationship between variables. At A-Level, a graph should normally have:
- the independent variable on the horizontal axis
- the dependent variable on the vertical axis
- labelled axes with units
- sensible scales using most of the grid
- accurately plotted points
- a best-fit line or curve, not dot-to-dot lines
- uncertainty bars if required or useful
- gradient or intercept calculations shown clearly
Best-fit line
A best-fit line is a line or curve that represents the overall trend of the data, with points scattered reasonably around it. It is not usually a line that joins the first point to the last point.
Using a graph to find a gradient
A student plots potential difference on the vertical axis against current on the horizontal axis for a resistor. Two well-separated points on the best-fit line are current = 0.20 A, potential difference = 1.6 V and current = 0.80 A, potential difference = 6.4 V.
- The gradient is found from change in vertical quantity divided by change in horizontal quantity:
- Substitute the two points from the best-fit line:
- Calculate the value and unit:
- For an ohmic resistor, the gradient of a potential difference against current graph is the resistance, so the resistance is 8.0 Ω.
Use points on the line
When finding a gradient, use two points on the best-fit line, far apart from each other. They do not have to be original data points.
Using software and digital tools
You may use software and tools to collect, process, analyse, research and present data. Examples include:
- spreadsheets for means, percentage differences and graph plotting
- data loggers for rapidly changing quantities
- graphing tools for best-fit lines and gradients
- word processors or presentation software for reports
- online databases or simulations for background research
Software is useful, but it does not remove your responsibility to think. You still need to check units, axes, scales, significant figures and whether the output makes physical sense.
Trusting software blindly
A spreadsheet can calculate a gradient to many decimal places, but that does not mean all those digits are meaningful. Quote answers to a sensible number of significant figures based on the data.
Research and referencing
Using sources well
Research helps you understand theory, compare accepted values, and design better methods. You can use online and offline sources, including textbooks, data books, journals, reputable websites and manufacturer datasheets.
Good research skills include checking:
- who produced the information
- whether the source is reliable and up to date
- whether the information agrees with other sources
- whether values have units and uncertainty where appropriate
- whether the source is relevant to your practical question
Citing sources
To cite a source means to state where information came from. This allows other people to check your work and gives credit to the original author.
A useful citation normally includes enough detail to find the source again, such as:
- author or organisation
- title of page, book or article
- date published or accessed
- web address for online sources
- publisher and edition for textbooks, where relevant
Referencing is part of scientific honesty
If a value, diagram, method or explanation came from a source, cite it. Your own measurements do not need a source, but published information does.
Instruments, equipment and techniques
Across the course, you will use a wide range of practical equipment linked to the physics content. The exact apparatus depends on the topic, but you should become confident with common instruments such as:
- metre rules, micrometers and vernier calipers for length
- stopwatches, light gates and data loggers for time
- balances and newtonmeters for mass and force
- ammeters, voltmeters, ohmmeters and power supplies for circuits
- thermometers and temperature probes
- oscilloscopes and signal generators for waves and electricity
- lenses, ray boxes, lasers and diffraction gratings for optics
- radiation detectors where appropriate and under supervision
Using equipment correctly includes selecting the right range, avoiding parallax error on analogue scales, zeroing instruments where needed, and not exceeding safe operating limits.
Parallax error
Parallax error occurs when a scale is viewed from an angle, causing the reading to appear different from its true value. Read scales with your eye perpendicular to the scale.
Selecting suitable equipment
You need to measure the diameter of a wire that is about 0.40 mm.
-
A metre rule is unsuitable because its resolution is about 1 mm, larger than the diameter being measured.
-
Vernier calipers may measure small distances, but the wire diameter is still close to the limit for reliable readings.
-
A micrometer is the best choice because it typically measures to 0.01 mm, giving several meaningful digits for a diameter near 0.40 mm.
-
To improve reliability, measure the diameter at several positions along the wire and calculate a mean.
Correct equipment can still give poor data
A high-resolution instrument does not guarantee accuracy. Zero error, poor alignment, heating, slipping contacts or inconsistent technique can still make results unreliable.
Drawing conclusions and evaluating
A conclusion should be based on evidence, not wishful thinking. It should state the relationship found and refer to data or graph features.
For example: “The graph of force against extension is a straight line through the origin within uncertainty, so force is directly proportional to extension over this range.”
Evaluation goes further. It asks how good the evidence is and how the method could be improved.
Useful evaluation points include:
- size of uncertainties compared with measured values
- whether repeats were consistent
- whether there were anomalous results
- whether the range of readings was large enough
- whether control variables were actually controlled
- whether the graph supports the proposed relationship
- specific improvements, such as using light gates instead of a stopwatch
Make improvements specific
“Use better equipment” is vague. “Use a light gate to reduce uncertainty in timing” is much stronger because it identifies the equipment and the reason.
In the exam
-
For planning questions, always link the independent variable, dependent variable and control variables to the actual experiment described.
-
For safety questions, give a hazard and a specific control measure; do not rely on vague phrases like “take care”.
-
For data questions, carry units through calculations, use graph gradients from well-separated points, and quote final answers to sensible significant figures.
Check yourself
- What is the difference between a hazard and a risk in a physics practical?
- Why should raw data be kept separate from processed data?
- When choosing equipment, why is resolution important but not the only thing that matters?
