

What you'll learn
- How to decide whether experimental results support a conclusion.
- How to identify anomalies without “cherry-picking” data.
- How to use accuracy, precision, margins of error, percentage errors and apparatus uncertainties.
- How to suggest practical improvements that directly fix limitations.
1. What evaluation means
Evaluation
Evaluation is the process of judging the quality of experimental evidence: how trustworthy the results are, whether the conclusion is justified, and how the method could be improved.
In practical physics, you are not just collecting numbers. You are asking: Do these results actually support the claim? A good conclusion usually includes:
- the pattern or relationship shown by the data
- a quantitative result, such as a mean, gradient, or derived constant
- a comparison with an accepted value or expected model
- a comment about uncertainty, anomalies, and limitations
A result is a processed value from data, such as a mean time, a gradient, or a calculated value of acceleration. A conclusion is the physics statement you draw from the result.
Evidence, not confidence
A strong conclusion does not sound certain just because the graph “looks good”. It is strong when the data, uncertainty and method all support it.
Judging whether a conclusion is supported
A student measures the speed of sound as (345±8) m s−1(345 \pm 8)\,\text{m s}^{-1}(345±8)m s−1. The accepted value is 343 m s−1343\,\text{m s}^{-1}343m s−1. Decide whether the student’s result supports the accepted value.
- The uncertainty interval is found from the value and its margin of error:
-
The accepted value, 343 m s−1343\,\text{m s}^{-1}343m s−1, lies between 337 m s−1337\,\text{m s}^{-1}337m s−1 and 353 m s−1353\,\text{m s}^{-1}353m s−1.
-
The result is therefore consistent with the accepted value within uncertainty. The conclusion should not be “exactly correct”; it should be that the method gives a value in agreement with the accepted value, within a margin of error of 8 m s−18\,\text{m s}^{-1}8m s−1.
2. How science uses results to validate knowledge
In real science, one successful experiment is rarely enough to establish new knowledge. The scientific community checks new results through peer review, independent replication, comparison with existing models, and careful reporting of uncertainty and limitations.
Peer review means other scientists examine the method, analysis and conclusions before publication. Replication means other researchers repeat the work independently to see whether they obtain consistent results.
Integrity matters. Scientists must report methods clearly, include uncertainty, record anomalies honestly, and avoid selecting only the data that supports their preferred conclusion.
Scientific integrity
Reliable new knowledge is built from transparent methods, repeatable results, honest uncertainty estimates, and independent checks by other scientists.
3. Identifying anomalies
Anomaly
An anomaly is a measurement or data point that does not fit the pattern of the other results, beyond what can reasonably be explained by normal experimental uncertainty.
An anomalous result is not automatically “wrong”. It might reveal a mistake, a temporary disturbance, a faulty reading, or even interesting physics. In A-Level practical evaluation, you should explain why it is anomalous.
You can identify anomalies by:
- comparing repeated readings taken under the same conditions
- checking whether a graph point lies far from the best-fit trend
- considering whether error bars would overlap the expected trend
- looking for a known cause, such as a slipped contact, misread scale, or draught
Deleting awkward points
Do not remove a point just because it makes the graph look neater. Exclude an anomaly only if you can justify it from the pattern, uncertainty, or a clear procedural reason.
Identifying an anomalous repeat
A student measures the period of an oscillator five times and records:
1.78 s, 1.80 s, 1.79 s, 2.11 s, 1.81 s
Decide whether any reading is anomalous and find a suitable mean period.
-
Four readings cluster closely between 1.78 s and 1.81 s, a spread of only 0.03 s. The reading 2.11 s is much larger than this cluster.
-
Compare the suspect reading with the cluster. The difference from a typical value of about 1.80 s is:
This is far greater than the spread of the other readings.
- Treat 2.11 s as anomalous, provided this is stated and justified. The mean of the consistent readings is:
- Quote the mean sensibly as 1.80 s1.80\,\text{s}1.80s, matching the precision of the measurements.
4. Limitations in experimental procedures
Limitation
A limitation is a feature of the method or apparatus that restricts the quality of the results, even if the experimenter is careful.
Good evaluation focuses on limitations that affect the data. Common examples include:
- limited resolution of a ruler, voltmeter, stopwatch, balance or protractor
- reaction time when starting or stopping a stopwatch
- zero error or poor calibration
- parallax error when reading a scale at an angle
- uncontrolled variables, such as temperature, friction or air resistance
- too small a range of data
- too few repeats
- assumptions in the model, such as treating friction as negligible
A limitation is not the same as a vague “human error”. In exams, “human error” is usually too imprecise unless you identify the actual mechanism, such as reaction time or parallax.
Finding the dominant limitation
A trolley travels 0.500 m0.500\,\text{m}0.500m down a ramp. The distance is measured with uncertainty ±0.001 m\pm 0.001\,\text{m}±0.001m. The time is measured with a handheld stopwatch as 0.92 s0.92\,\text{s}0.92s, with reaction-time uncertainty about ±0.20 s\pm 0.20\,\text{s}±0.20s. Identify the main limitation.
- Calculate the percentage uncertainty in distance:
- Calculate the percentage uncertainty in time:
-
The timing uncertainty is vastly larger than the distance uncertainty, so the dominant limitation is the use of a handheld stopwatch.
-
Since acceleration calculations often involve t2t^2t2, for example s=12at2s = \frac{1}{2}at^2s=21at2 for motion from rest, uncertainty in time has an even stronger effect on the final value. A light gate or motion sensor would be a targeted improvement.
5. Precision, accuracy and errors
Precision and accuracy
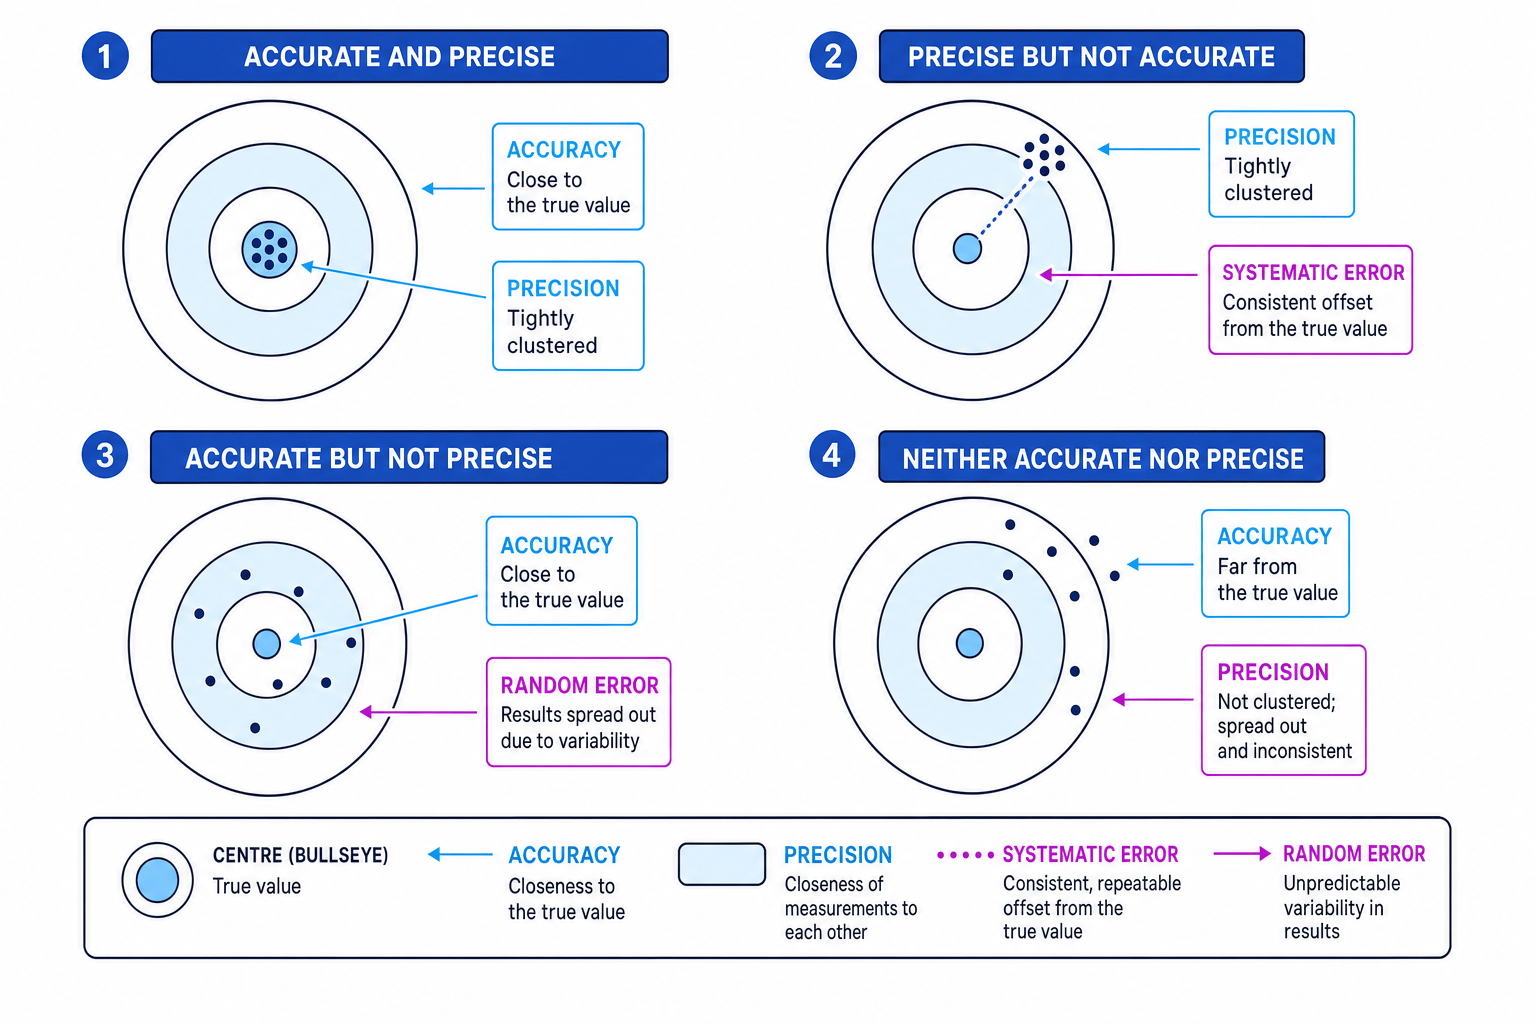
Precision is how close repeated measurements are to each other. Accuracy is how close a measurement is to the true or accepted value.
A set of results can be precise but not accurate. For example, a miscalibrated voltmeter might give very consistent readings, but all of them could be too high. That is a systematic error: a consistent offset from the true value.
A random error causes unpredictable scatter in repeated readings. Repeating measurements and taking a mean helps reduce the effect of random errors, but it does not remove systematic errors.
Apparatus uncertainty
The absolute uncertainty is the uncertainty written with units, such as ±0.001 m\pm 0.001\,\text{m}±0.001m or ±0.02 A\pm 0.02\,\text{A}±0.02A.
Typical rules are:
- for an analogue scale, use about half the smallest scale division, unless stated otherwise
- for a digital instrument, use about the smallest displayed increment, unless stated otherwise
- for repeated readings, use the spread of results, often half the range, as an estimate of uncertainty
The percentage uncertainty is:
percentage uncertainty=absolute uncertaintymeasured value×100% \text{percentage uncertainty} = \frac{\text{absolute uncertainty}}{\text{measured value}}\times 100\% percentage uncertainty=measured valueabsolute uncertainty×100%The percentage error compares an experimental value with an accepted value:
percentage error=∣experimental value−accepted value∣accepted value×100% \text{percentage error} = \frac{|\text{experimental value} - \text{accepted value}|}{\text{accepted value}}\times 100\% percentage error=accepted value∣experimental value−accepted value∣×100%Margin of error
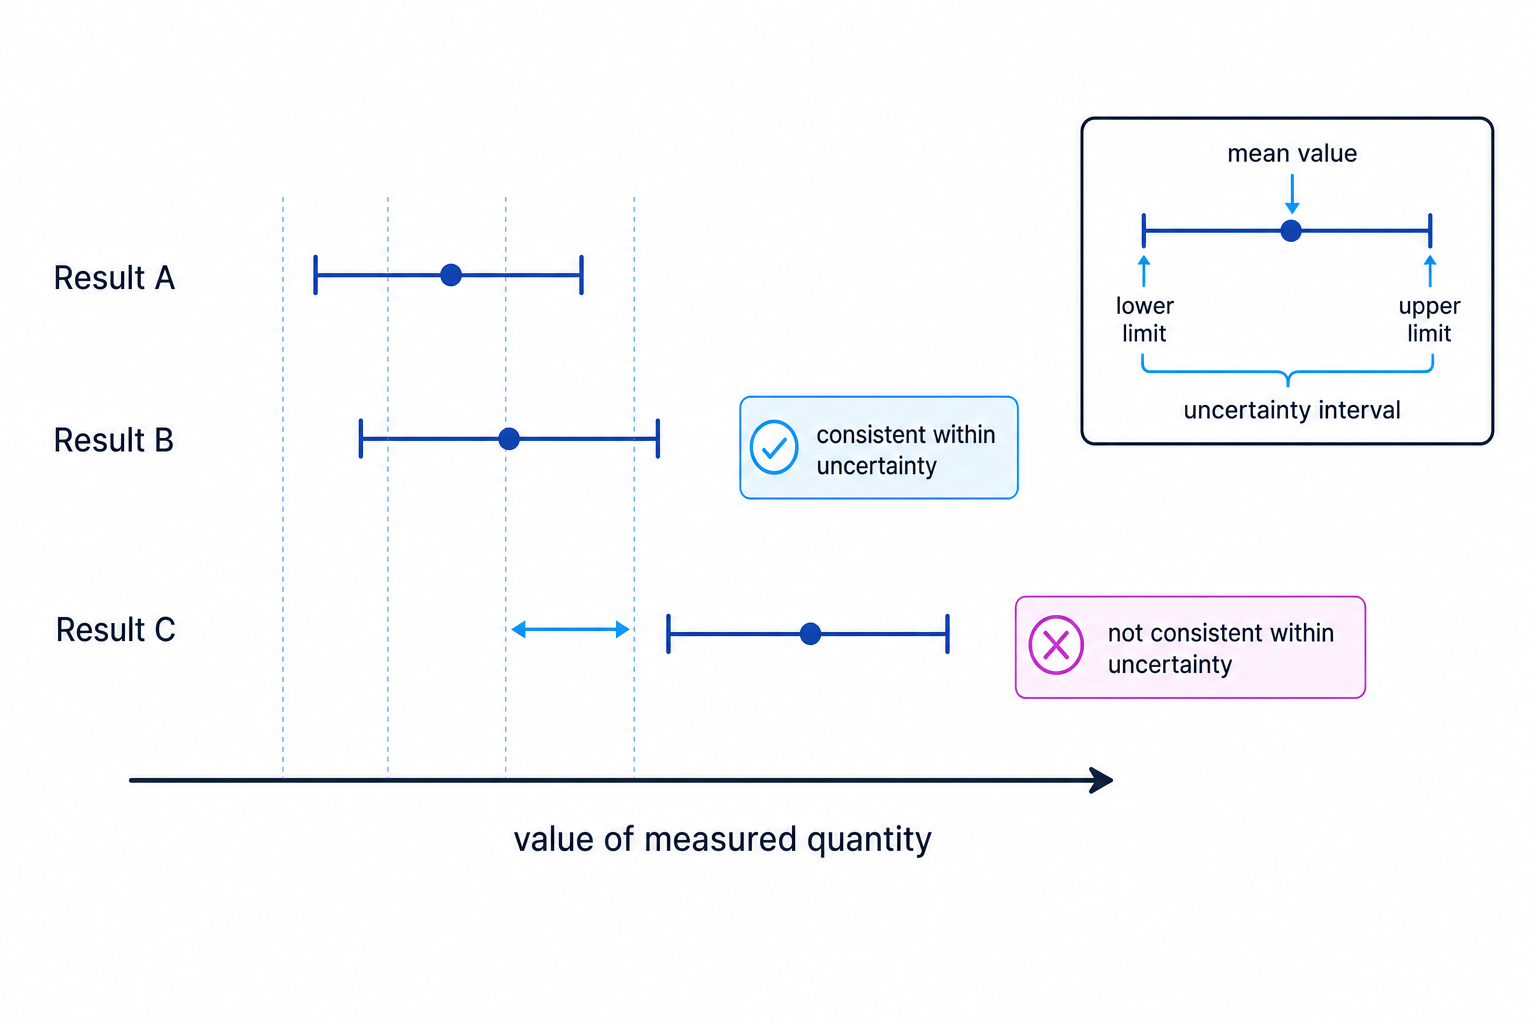
A margin of error is the uncertainty interval around a result, usually written as value ±\pm± absolute uncertainty.
If uncertainty intervals overlap, the results are usually described as consistent within uncertainty. If they do not overlap, that suggests a real disagreement, an unaccounted systematic error, or an underestimated uncertainty.
Uncertainty is not percentage error
Percentage uncertainty tells you how precise a measurement is. Percentage error tells you how far an experimental result is from an accepted value.
Calculating uncertainty and percentage error
A student measures the potential difference across a resistor as (3.20±0.01) V(3.20 \pm 0.01)\,\text{V}(3.20±0.01)V and the current through it as (0.160±0.001) A(0.160 \pm 0.001)\,\text{A}(0.160±0.001)A. The accepted resistance is 19.8 Ω19.8\,\Omega19.8Ω. Evaluate the result.
- Use V=IRV = IRV=IR, so R=VIR = \frac{V}{I}R=IV:
- Calculate the percentage uncertainty in potential difference:
Calculate the percentage uncertainty in current:
0.0010.160×100%=0.625%≈0.63% \frac{0.001}{0.160}\times 100\% = 0.625\% \approx 0.63\% 0.1600.001×100%=0.625%≈0.63%- For division, add percentage uncertainties:
The absolute uncertainty in resistance is:
0.0094×20.0 Ω=0.188 Ω≈0.2 Ω 0.0094 \times 20.0\,\Omega = 0.188\,\Omega \approx 0.2\,\Omega 0.0094×20.0Ω=0.188Ω≈0.2ΩSo the result is (20.0±0.2) Ω(20.0 \pm 0.2)\,\Omega(20.0±0.2)Ω.
- Calculate the percentage error compared with the accepted value:
The accepted value lies at the lower edge of the interval from 19.8 Ω19.8\,\Omega19.8Ω to 20.2 Ω20.2\,\Omega20.2Ω, so the result is consistent with the accepted value within uncertainty.
6. Refining experimental design
Refining an experiment means improving the procedure or apparatus to reduce uncertainty, reduce systematic error, or make the test more valid.
Strong improvements are specific. Instead of saying “use better equipment”, say what equipment and why it improves the result.
Useful improvement patterns include:
- increase the measured quantity to reduce percentage uncertainty
- use a higher-resolution instrument
- use a data logger, light gate or sensor to reduce reaction-time effects
- calibrate instruments and check for zero error
- repeat readings and calculate a mean
- take a wider range of values and use a graph
- control variables that should remain constant
- reduce energy losses, heating, friction or air resistance where relevant
Improvement sentence structure
A good improvement sentence has three parts: change the method, name the limitation, and explain the effect on the data.
Improving a Young modulus measurement
In an experiment to determine the Young modulus of a wire, the extension is about 0.7 mm0.7\,\text{mm}0.7mm and is measured using a ruler with millimetre divisions. Suggest targeted improvements.
- The extension is very small compared with the ruler resolution. If the uncertainty is about ±0.5 mm\pm 0.5\,\text{mm}±0.5mm, the percentage uncertainty is:
This makes extension the dominant limitation.
-
Use a longer wire or a larger load, while staying below the elastic limit, so the extension is larger. A larger extension gives a smaller percentage uncertainty.
-
Measure extension using a vernier scale, travelling microscope or digital displacement sensor rather than a ruler. This directly reduces the absolute uncertainty in extension.
-
Measure the wire diameter at several points and in different orientations using a micrometer. Since cross-sectional area depends on d2d^2d2, small diameter errors strongly affect the calculated Young modulus.
In the exam
- When evaluating a conclusion, compare values using uncertainty intervals and state whether they agree within uncertainty.
- For limitations and improvements, link the apparatus or procedure to its effect on precision, accuracy, uncertainty or validity.
- Treat anomalies transparently: identify them from the pattern, justify any exclusion, and do not use vague phrases like “human error” without detail.
Check yourself
- What is the difference between percentage uncertainty and percentage error?
- How would you decide whether a point on a graph is anomalous?
- Why is “repeat the experiment” often an incomplete improvement?
