

What you'll learn
- How to describe motion using displacement, speed, velocity and acceleration.
- How to tell the difference between scalar and vector quantities.
- How to extract motion information from displacement–time and velocity–time graphs.
- How to use gradients and areas to calculate velocity, acceleration and displacement.
1. Describing motion clearly
Kinematics is the study of motion without worrying about what caused the motion. In this section, you are mainly asking: where is the object, how fast is it moving, and how is its motion changing?
Scalars and vectors
A scalar quantity has magnitude only. Magnitude means size. Examples include distance, speed, time and mass.
A vector quantity has both magnitude and direction. Examples include displacement, velocity, acceleration and force.
Scalar and vector
A scalar has magnitude only. A vector has magnitude and direction, so signs such as positive and negative can represent direction in one-dimensional motion.
Distance and displacement
Distance is the total length of the path travelled. It does not include direction, so it is a scalar.
Displacement is the straight-line change in position from the starting point to the finishing point, in a stated direction. It is a vector.
For example, if you walk 3 m east and then 3 m west, your distance travelled is 6 m, but your displacement is 0 m because you ended where you started.
Distance is not displacement
If an object turns around, the distance travelled keeps increasing, but the displacement can decrease or even return to zero.
Speed and velocity
Speed is the rate of change of distance. It is a scalar, measured in metres per second, m s−1^{-1}−1.
The average speed over a journey is:
average speed=total distance travelledtime taken\text{average speed} = \frac{\text{total distance travelled}}{\text{time taken}}average speed=time takentotal distance travelledVelocity is the rate of change of displacement. It is a vector, also measured in metres per second, m s−1^{-1}−1. In one-dimensional motion, a positive velocity means motion in the chosen positive direction; a negative velocity means motion in the opposite direction.
Instantaneous speed
Instantaneous speed is the speed of an object at a particular instant in time, like the reading on a speedometer.
Acceleration
Acceleration is the rate of change of velocity. It is a vector, measured in metres per second squared, m s−2^{-2}−2.
For a change in velocity Δv\Delta vΔv over a time interval Δt\Delta tΔt:
a=ΔvΔta = \frac{\Delta v}{\Delta t}a=ΔtΔvIf acceleration is in the same direction as velocity, the object speeds up. If acceleration is in the opposite direction to velocity, the object slows down.
Acceleration is about velocity, not just speed
An object can be accelerating because its speed changes, its direction changes, or both. In this topic you mostly deal with one-dimensional motion, so direction is usually shown using positive and negative signs.
Comparing average speed, average velocity and acceleration
A cyclist travels 120 m east in 20 s, then 40 m west in the next 10 s. Their velocity changes from 8.0 m s−1^{-1}−1 east to 4.0 m s−1^{-1}−1 west during those final 10 s. Take east as positive.
-
The total distance travelled is 120+40=160 m120 + 40 = 160 \text{ m}120+40=160 m, and the total time is 20+10=30 s20 + 10 = 30 \text{ s}20+10=30 s, so the average speed is:
160 m30 s=5.3 m s−1\frac{160 \text{ m}}{30 \text{ s}} = 5.3 \text{ m s}^{-1}30 s160 m=5.3 m s−1 -
The final displacement is 120−40=80 m120 - 40 = 80 \text{ m}120−40=80 m east, so the average velocity is:
80 m30 s=2.7 m s−1 east\frac{80 \text{ m}}{30 \text{ s}} = 2.7 \text{ m s}^{-1} \text{ east}30 s80 m=2.7 m s−1 east -
During the final 10 s, the velocity changes from +8.0 m s−1+8.0 \text{ m s}^{-1}+8.0 m s−1 to −4.0 m s−1-4.0 \text{ m s}^{-1}−4.0 m s−1, so:
a=−4.0−8.010=−1.2 m s−2a = \frac{-4.0 - 8.0}{10} = -1.2 \text{ m s}^{-2}a=10−4.0−8.0=−1.2 m s−2The negative acceleration means the acceleration is westwards.
2. Graphs as motion stories
Graphs are a compact way to represent motion. Always check:
- what is on the vertical axis,
- what is on the horizontal axis,
- the units,
- whether the graph is showing displacement, speed, velocity or acceleration.
A data logger, light gate, motion sensor or video-analysis software can collect motion data automatically. This is useful because it gives many data points, making gradients and areas more reliable than if you only had a few manual readings.
Displacement, speed, velocity and acceleration graphs
A displacement–time graph shows how position changes with time.
A speed–time graph shows how the magnitude of speed changes with time. Speed cannot be negative.
A velocity–time graph shows how velocity changes with time. Velocity can be positive, zero or negative.
An acceleration–time graph shows how acceleration changes with time.
Read the axis label first
A graph labelled speed–time and a graph labelled velocity–time are not the same. Velocity can go below the time axis; speed cannot.
3. Displacement–time graphs
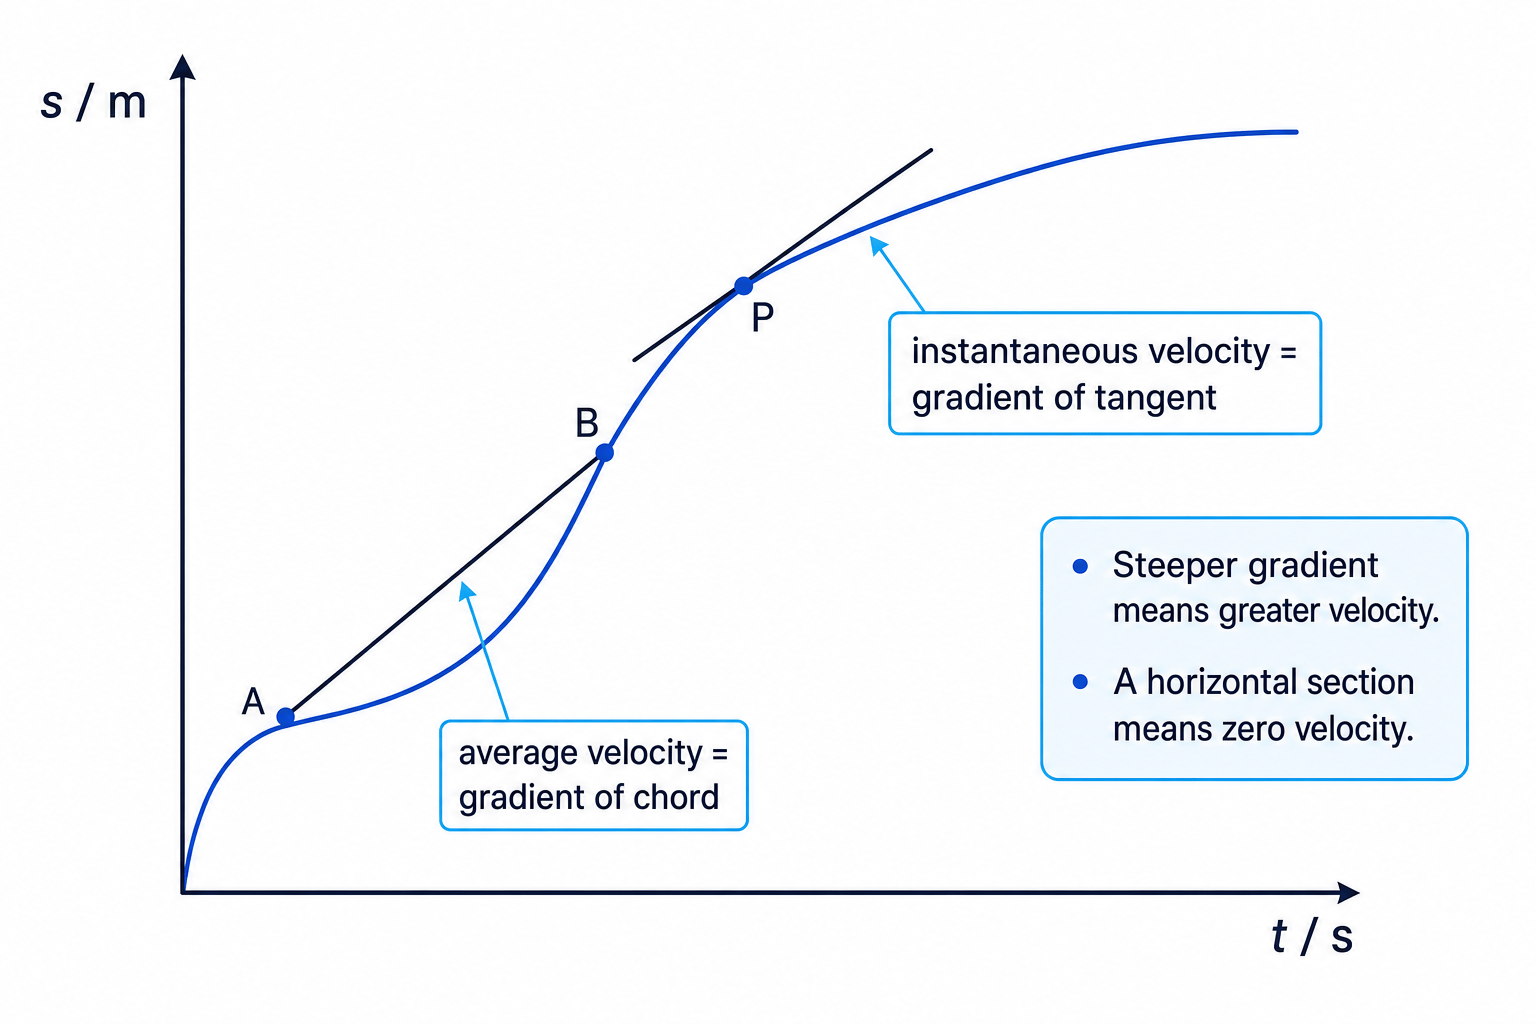
On a displacement–time graph, the gradient tells you the velocity.
velocity=gradient of a displacement–time graph\text{velocity} = \text{gradient of a displacement–time graph}velocity=gradient of a displacement–time graphFor a straight-line section:
v=ΔsΔtv = \frac{\Delta s}{\Delta t}v=ΔtΔswhere Δs\Delta sΔs is the change in displacement and Δt\Delta tΔt is the change in time.
If the graph is curved, the velocity is changing. The instantaneous velocity at one point is found from the gradient of the tangent to the curve at that point.
What the shape tells you
- A steeper positive gradient means a greater positive velocity.
- A horizontal line means zero velocity because displacement is not changing.
- A negative gradient means negative velocity, so the object is moving in the opposite direction.
- A curve means changing velocity.
Finding velocity from a displacement–time graph
A straight section of a displacement–time graph goes from 2.0 m at 1.0 s to 14.0 m at 5.0 s. Find the velocity during this section.
-
Use the gradient because this is a displacement–time graph:
v=ΔsΔtv = \frac{\Delta s}{\Delta t}v=ΔtΔs -
Calculate the change in displacement and the change in time:
Δs=14.0−2.0=12.0 m\Delta s = 14.0 - 2.0 = 12.0 \text{ m}Δs=14.0−2.0=12.0 m Δt=5.0−1.0=4.0 s\Delta t = 5.0 - 1.0 = 4.0 \text{ s}Δt=5.0−1.0=4.0 s -
Substitute into the gradient calculation:
v=12.0 m4.0 s=3.0 m s−1v = \frac{12.0 \text{ m}}{4.0 \text{ s}} = 3.0 \text{ m s}^{-1}v=4.0 s12.0 m=3.0 m s−1
Using the graph height instead of the gradient
On a displacement–time graph, the vertical value is displacement, not velocity. Velocity comes from the gradient.
4. Velocity–time graphs
On a velocity–time graph, the gradient tells you the acceleration.
acceleration=gradient of a velocity–time graph\text{acceleration} = \text{gradient of a velocity–time graph}acceleration=gradient of a velocity–time graphFor a straight-line section:
a=ΔvΔta = \frac{\Delta v}{\Delta t}a=ΔtΔvThe area under a velocity–time graph gives displacement.
displacement=area under a velocity–time graph\text{displacement} = \text{area under a velocity–time graph}displacement=area under a velocity–time graphThis works because the units of area are:
m s−1×s=m\text{m s}^{-1} \times \text{s} = \text{m}m s−1×s=m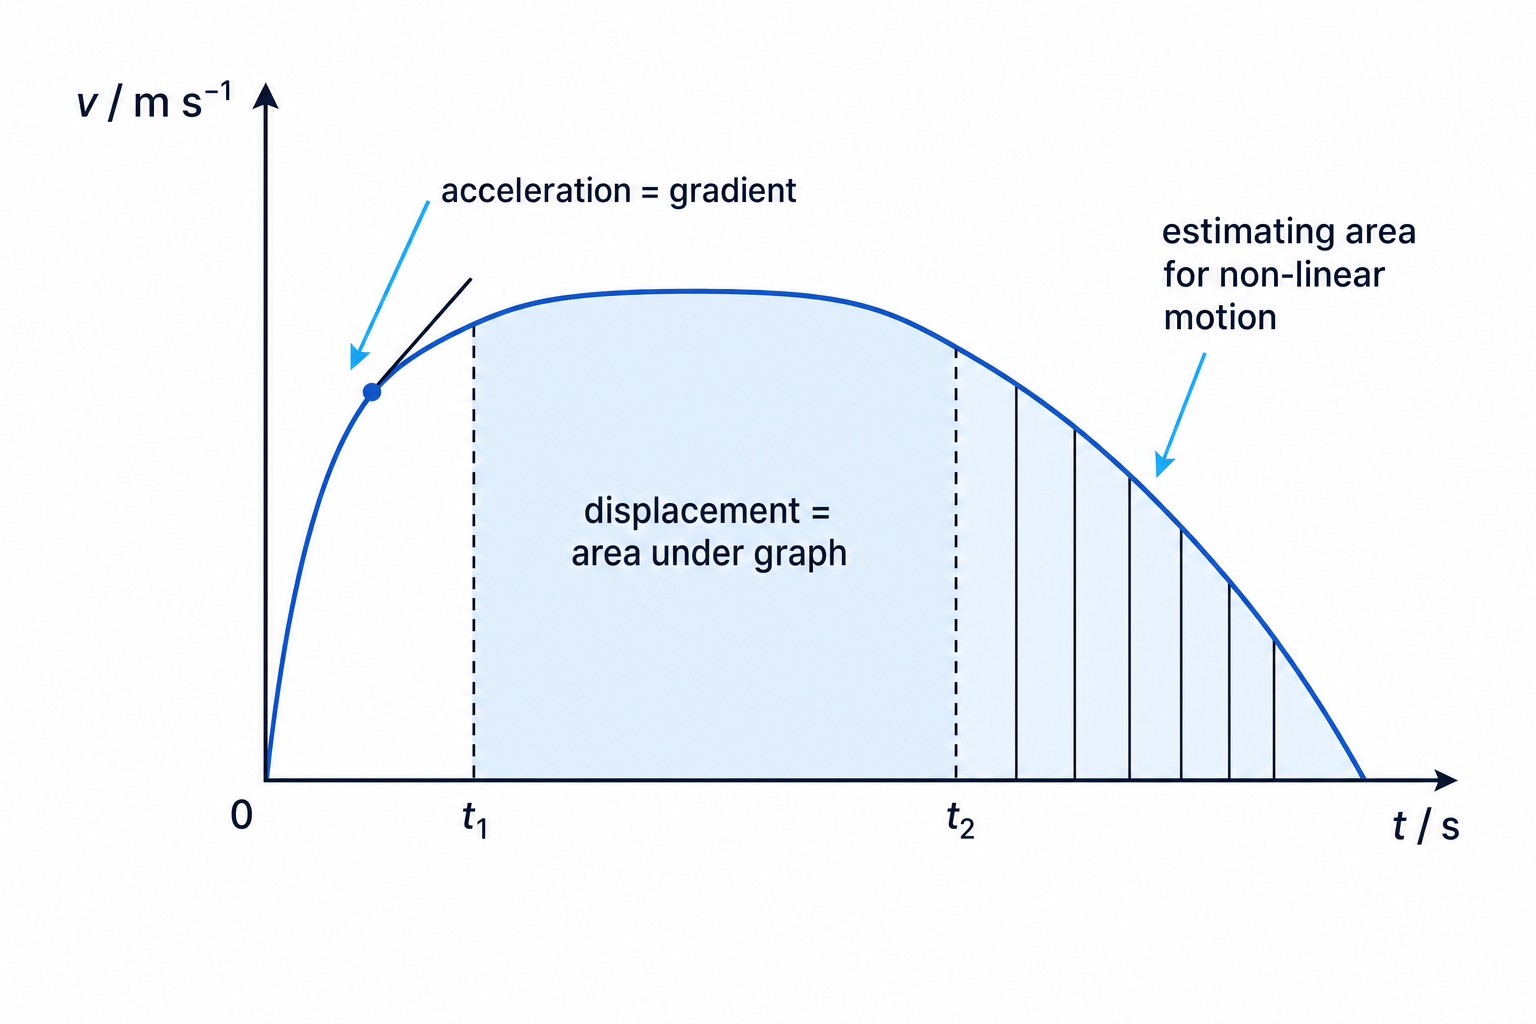
Positive and negative areas
If the velocity is above the time axis, the area is positive displacement. If the velocity is below the time axis, the area is negative displacement.
If you want distance travelled, add the magnitudes of the areas. If you want displacement, include the signs.
Gradient and area do different jobs
On a velocity–time graph, the gradient gives acceleration, while the area under the graph gives displacement.
Using a velocity–time graph
A car’s velocity increases uniformly from 0 m s−1^{-1}−1 to 12 m s−1^{-1}−1 in 4.0 s, then stays at 12 m s−1^{-1}−1 for 6.0 s. Find the acceleration during the first 4.0 s and the displacement during the full 10.0 s.
-
Use the gradient of the first section for acceleration:
a=12−04.0=3.0 m s−2a = \frac{12 - 0}{4.0} = 3.0 \text{ m s}^{-2}a=4.012−0=3.0 m s−2 -
Split the area under the graph into a triangle and a rectangle. The triangle has base 4.0 s and height 12 m s−1^{-1}−1:
triangle area=12×4.0 s×12 m s−1=24 m\text{triangle area} = \frac{1}{2} \times 4.0 \text{ s} \times 12 \text{ m s}^{-1} = 24 \text{ m}triangle area=21×4.0 s×12 m s−1=24 m -
The rectangle has width 6.0 s and height 12 m s−1^{-1}−1:
rectangle area=6.0 s×12 m s−1=72 m\text{rectangle area} = 6.0 \text{ s} \times 12 \text{ m s}^{-1} = 72 \text{ m}rectangle area=6.0 s×12 m s−1=72 m -
Add the areas to find the total displacement:
24 m+72 m=96 m24 \text{ m} + 72 \text{ m} = 96 \text{ m}24 m+72 m=96 m
5. Estimating area under a non-linear velocity–time graph
If a velocity–time graph is curved, the area may not be a simple triangle or rectangle. You can estimate the displacement by:
- counting squares under the curve,
- splitting the area into trapezia,
- using narrower strips for a better estimate.
For a trapezium with parallel sides aaa and bbb, separated by width hhh:
area=12(a+b)h\text{area} = \frac{1}{2}(a+b)harea=21(a+b)hOn a velocity–time graph, the parallel sides are velocity values, and the width is the time interval.
Estimating displacement with trapezia
A velocity–time graph has these readings: at 0 s, 0 m s−1^{-1}−1; at 2.0 s, 5.0 m s−1^{-1}−1; at 4.0 s, 8.0 m s−1^{-1}−1; at 6.0 s, 9.0 m s−1^{-1}−1. Estimate the displacement from 0 s to 6.0 s.
-
Use three trapezia, each with width 2.0 s, because the velocity readings are separated by equal 2.0 s intervals.
-
Calculate each trapezium area:
12(0+5.0)(2.0)=5.0 m\frac{1}{2}(0 + 5.0)(2.0) = 5.0 \text{ m}21(0+5.0)(2.0)=5.0 m 12(5.0+8.0)(2.0)=13 m\frac{1}{2}(5.0 + 8.0)(2.0) = 13 \text{ m}21(5.0+8.0)(2.0)=13 m 12(8.0+9.0)(2.0)=17 m\frac{1}{2}(8.0 + 9.0)(2.0) = 17 \text{ m}21(8.0+9.0)(2.0)=17 m -
Add the estimated areas:
5.0 m+13 m+17 m=35 m5.0 \text{ m} + 13 \text{ m} + 17 \text{ m} = 35 \text{ m}5.0 m+13 m+17 m=35 m
Area gives displacement, not always distance
If part of a velocity–time graph is below the time axis, its area is negative. For total distance travelled, add the sizes of the positive and negative areas instead.
6. Acceleration–time graphs
An acceleration–time graph shows how acceleration varies with time. A horizontal line means constant acceleration. A line on the time axis means zero acceleration, so the velocity is constant.
The area under an acceleration–time graph gives the change in velocity, because:
m s−2×s=m s−1\text{m s}^{-2} \times \text{s} = \text{m s}^{-1}m s−2×s=m s−1You will use the same graph skills: read the axes carefully, use gradients only when the graph type calls for them, and use units to check what your answer represents.
Use units as a sanity check
If your calculation gives m s−2^{-2}−2, it is probably an acceleration. If it gives m, it is probably a displacement or distance. If it gives m s−1^{-1}−1, it is probably a speed or velocity.
In the exam
- Identify the graph type before doing anything: displacement–time, velocity–time, speed–time or acceleration–time.
- For gradients, choose two well-spaced points on the line or tangent, then calculate change in vertical quantity divided by change in horizontal quantity.
- For areas under velocity–time graphs, split the shape into rectangles, triangles or trapezia, and keep negative areas negative if displacement is required.
Check yourself
- What is the difference between average speed and average velocity for a journey where the object turns around?
- On a displacement–time graph, what does a horizontal line mean?
- On a velocity–time graph, how would you find acceleration and displacement?
