

What you'll learn
- How to use practical apparatus and measurement techniques correctly.
- How to choose and write appropriate units for measurements.
- How to present observations and data in clear tables, graphs and notes.
- How exam questions may test practical implementation, even without you doing the experiment.
What “implementing” means
In OCR A-Level Physics, implementing is the practical skill of carrying out an investigation well. It sits between planning the experiment and analysing the results.
Implementing
Implementing means using apparatus correctly, taking measurements with suitable units, and recording observations or data in a format that can be checked, repeated and analysed.
A good practical record should let another physicist understand what you measured, how you measured it, and how reliable the measurements are.
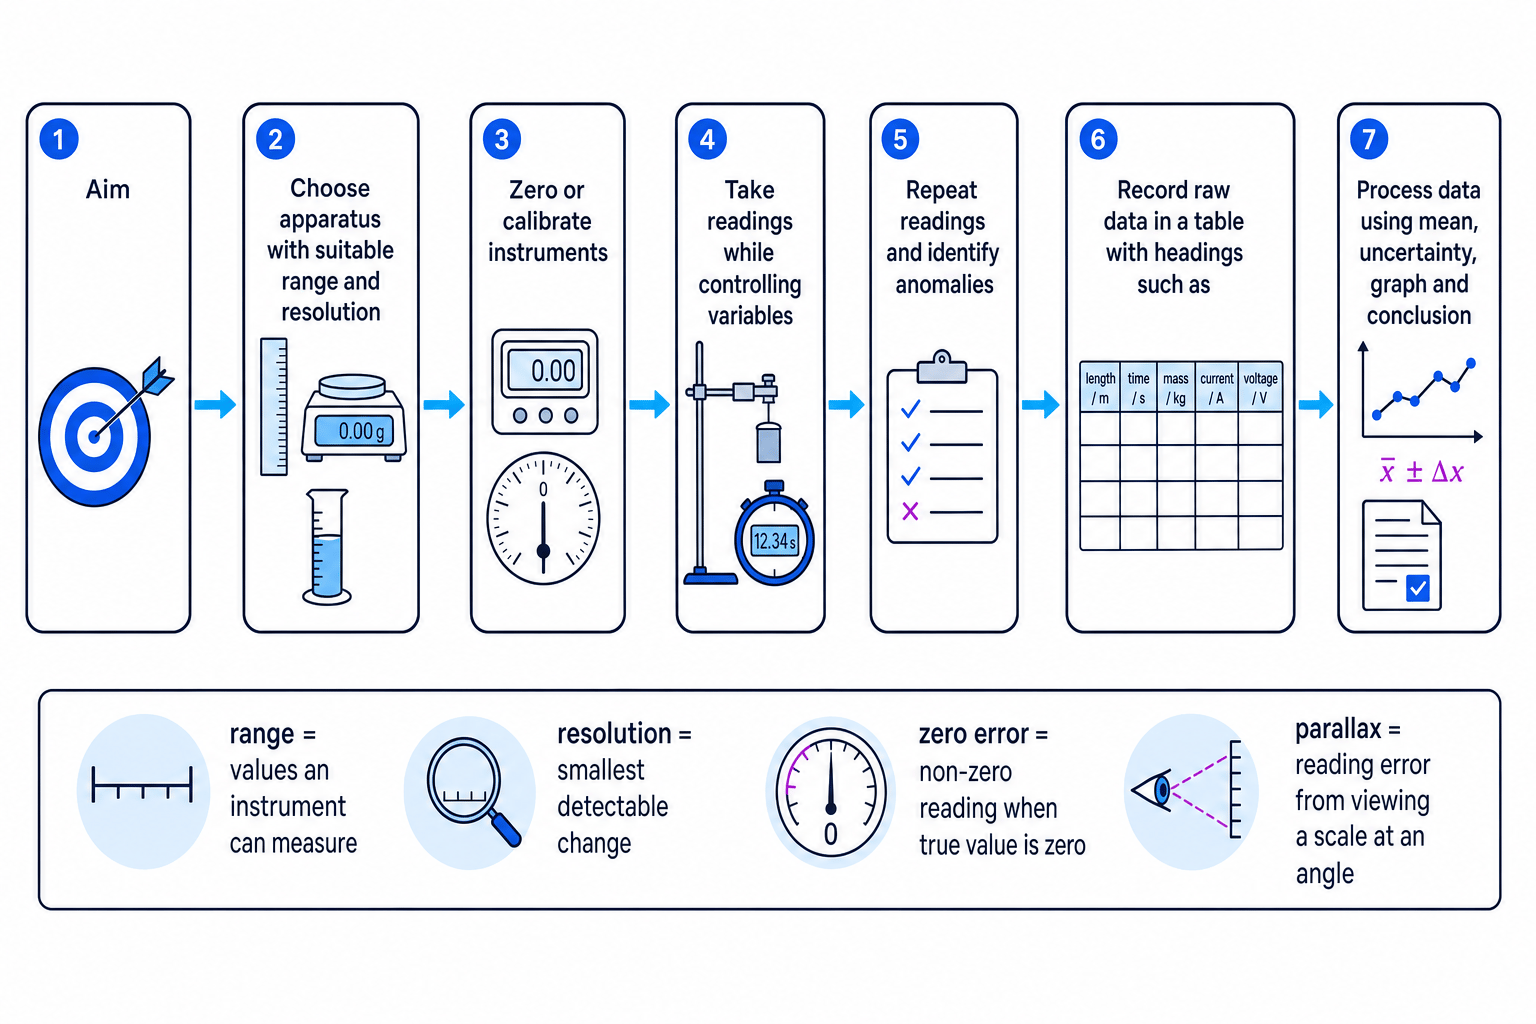
Starting point: what are you measuring?
Before touching the apparatus, identify the quantities in the experiment.
Variables
The independent variable is the quantity you deliberately change. The dependent variable is the quantity you measure in response. A control variable is a quantity kept constant so the test remains valid.
For example, in an experiment investigating how the current through a resistor depends on potential difference, the potential difference may be the independent variable and the current is the dependent variable. The temperature of the resistor should be controlled as far as possible, because resistance can change with temperature.
Validity and reliability
A measurement is valid if it measures what it is meant to measure. A set of results is reliable if repeated measurements are consistent.
Using apparatus correctly
Choosing suitable apparatus
Different instruments are suitable for different jobs. You should think about both range and resolution.
Range, resolution and zero error
- The range of an instrument is the interval of values it can measure.
- The resolution is the smallest change in the measured quantity that the instrument can detect or display.
- A zero error occurs when an instrument gives a non-zero reading when the true value is zero.
- Calibration means checking or adjusting an instrument against a known standard.
A ruler with millimetre divisions is useful for measuring a 20 cm length, but not for measuring the diameter of a thin wire. A micrometer is much better for the wire because it has a much smaller resolution.
When using apparatus, also think about the technique:
- Read analogue scales at eye level to avoid parallax error, where the reading changes because you view the scale from an angle.
- Zero the instrument before use, or record and correct for any zero error.
- Use the correct range on meters so readings are not off-scale or unnecessarily imprecise.
- Keep the setup stable, aligned and safe.
- Repeat readings where random variation is expected.
Choosing apparatus for wire measurements
You need to measure the diameter of a wire, about 0.30 mm, and its length, about 1.00 m.
-
Compare the size of the measurement with the resolution of possible instruments. A metre rule with 1 mm divisions cannot sensibly measure a diameter of about 0.30 mm. A micrometer with resolution 0.01 mm gives a fractional scale division of
0.01 mm0.30 mm×100%≈3.3%\frac{0.01\,\text{mm}}{0.30\,\text{mm}} \times 100\% \approx 3.3\%0.30mm0.01mm×100%≈3.3%, which is much more suitable. -
Check that the expected value lies within the instrument range. A micrometer with range 0 to 25 mm includes 0.30 mm, so it can measure the diameter. A metre rule or tape measure can measure the length of about 1.00 m.
-
Apply the correct technique. For the micrometer, check the zero reading, use the ratchet to avoid crushing the wire, and measure the diameter at several positions along the wire.
-
Choose the final apparatus. Use the micrometer for diameter and the metre rule or tape measure for length, because each instrument has a suitable range and resolution for its measurement.
False precision
Do not write extra decimal places just to make an answer look more scientific. A reading from a scale marked every 1 mm should not be recorded as though it were measured to 0.001 mm.
Appropriate units for measurements
A measurement is not complete without a unit. “The length is 0.25” is meaningless; “the length is 0.25 m” is useful.
SI units
SI units are the standard international units used in physics. Common base units include metre m, kilogram kg, second s, ampere A and kelvin K. Derived units include newton N, joule J, watt W, volt V, ohm Ω, coulomb C, hertz Hz and pascal Pa.
You may also use standard prefixes, such as:
- milli, m, meaning 10−310^{-3}10−3
- micro, µ, meaning 10−610^{-6}10−6
- kilo, k, meaning 10310^3103
- mega, M, meaning 10610^6106
So 250 mA means 0.250 A, and 3.5 kΩ means 3500 Ω.
Units must match the equation
Before substituting values into an equation, convert them into consistent units. In most A-Level calculations, that means SI units such as m, kg, s, A, K, V and Ω.
Units in calculated quantities
Units also help you check calculations. If you divide distance in metres by time in seconds, the unit must be metres per second, m s−1^{-1}−1. If you find a graph gradient, the gradient unit is:
gradient unit=vertical-axis unithorizontal-axis unit\text{gradient unit} = \frac{\text{vertical-axis unit}}{\text{horizontal-axis unit}}gradient unit=horizontal-axis unitvertical-axis unitFor example, on a force-extension graph with force in N and extension in m, the gradient has unit N m−1^{-1}−1.
Converting units before calculating speed
A trolley travels 85.0 cm in 0.42 s. Calculate its average speed.
-
Convert the distance into metres because the SI unit of distance is m.
85.0 cm = 0.850 m. -
Use the relationship for average speed:
v=stv = \frac{s}{t}v=ts
so
v=0.850 m0.42 s=2.0238 m s−1v = \frac{0.850\,\text{m}}{0.42\,\text{s}} = 2.0238\,\text{m s}^{-1}v=0.42s0.850m=2.0238m s−1. -
Quote the answer to a sensible number of significant figures. The time 0.42 s has 2 significant figures, so
v≈2.0 m s−1v \approx 2.0\,\text{m s}^{-1}v≈2.0m s−1.
Unit headings in tables
Write units once in the column heading, such as length / m or current / A. Do not put the unit after every value in the body of the table.
Presenting observations and data
Raw data, processed data and observations
Raw data and processed data
Raw data are the readings recorded directly from instruments. Processed data are values calculated from raw data, such as means, differences, gradients or derived quantities. An observation is information noticed during the experiment; it may be numerical or descriptive.
For example, “current = 0.42 A” is numerical data. “The wire became warm at higher currents” is a descriptive observation. Both can be useful.
You should record raw data immediately, not later from memory. If a reading looks anomalous, do not silently delete it. Mark it and decide later whether there is a justified reason to exclude it.
Good results tables
A clear results table usually has:
- the independent variable in the first column;
- column headings in the form
quantity / unit; - repeated readings in separate columns;
- a mean column if repeated readings are processed;
- consistent decimal places for readings taken with the same instrument;
- observations noted where they help explain the data.
The mean of repeated readings is:
xˉ=∑xin\bar{x} = \frac{\sum x_i}{n}xˉ=n∑xiwhere xˉ\bar{x}xˉ is the mean, xix_ixi are the individual readings, and nnn is the number of readings.
Designing a results table for an I-V investigation
A student varies the potential difference across a fixed resistor and measures the current three times for each setting.
-
Put the independent variable first. The student chooses the potential difference, so it goes in the first column with the heading
potential difference / V. -
Keep repeated current readings separate. This makes it possible to judge scatter and identify anomalies before calculating a mean.
-
Calculate the mean current for each row. For currents 0.39 A, 0.41 A and 0.40 A:
Iˉ=0.39 A+0.41 A+0.40 A3=0.40 A\bar{I} = \frac{0.39\,\text{A} + 0.41\,\text{A} + 0.40\,\text{A}}{3} = 0.40\,\text{A}Iˉ=30.39A+0.41A+0.40A=0.40A.
| Potential difference / V | Current 1 / A | Current 2 / A | Current 3 / A | Mean current / A | Observation |
|---|---|---|---|---|---|
| 1.00 | 0.20 | 0.21 | 0.20 | 0.20 | Resistor cool |
| 2.00 | 0.39 | 0.41 | 0.40 | 0.40 | Resistor cool |
| 3.00 | 0.61 | 0.60 | 0.62 | 0.61 | Slight warming |
Presenting data on graphs
Graphs are useful when you want to show a relationship between two continuous variables.
A good graph should have:
- the independent variable on the horizontal axis;
- the dependent variable on the vertical axis;
- labelled axes with units;
- sensible scales that use most of the grid;
- accurately plotted points;
- a line or curve of best fit, not dot-to-dot joins;
- error bars if uncertainties are being shown.
Mixing raw and processed data unclearly
Do not overwrite raw readings with rounded means. Keep raw data visible, then show processed values in separate columns or clearly labelled calculations.
Practical observations: what to write down
Not every useful observation is a number. In practical physics, you might note that:
- a filament lamp becomes brighter and hotter;
- oscillations decrease in amplitude over time;
- a wire slips, stretches or heats up;
- a light gate misses a flag;
- a reading fluctuates rather than settles.
These notes help explain scatter, anomalies and limitations later in the evaluation.
In the exam
- When asked about apparatus, name the instrument and justify it using range, resolution or correct technique.
- Always include units with measurements, table headings, graph axes and final calculated answers.
- Convert prefixed or non-SI readings before substituting into equations.
- For data presentation, show raw readings, repeats, means and anomalies clearly rather than hiding them.
Check yourself
- Why might a micrometer be better than a ruler for measuring the diameter of a wire?
- What is wrong with a table column headed only
time? - How would you record three repeated current readings and their mean without losing the raw data?
