

What you'll learn
- How to turn a physics question into a testable investigation.
- How to decide what to change, what to measure, and what to keep constant.
- How to choose measuring instruments and techniques that fit the task.
- How to judge whether a method can actually produce useful evidence.
Why planning matters
Practical planning is deciding, before you start, how an experiment will test a physics idea. In OCR A-Level Physics, this skill is assessed in written papers as well as in practical work, so you need to explain not just what you would do, but why that method is suitable.
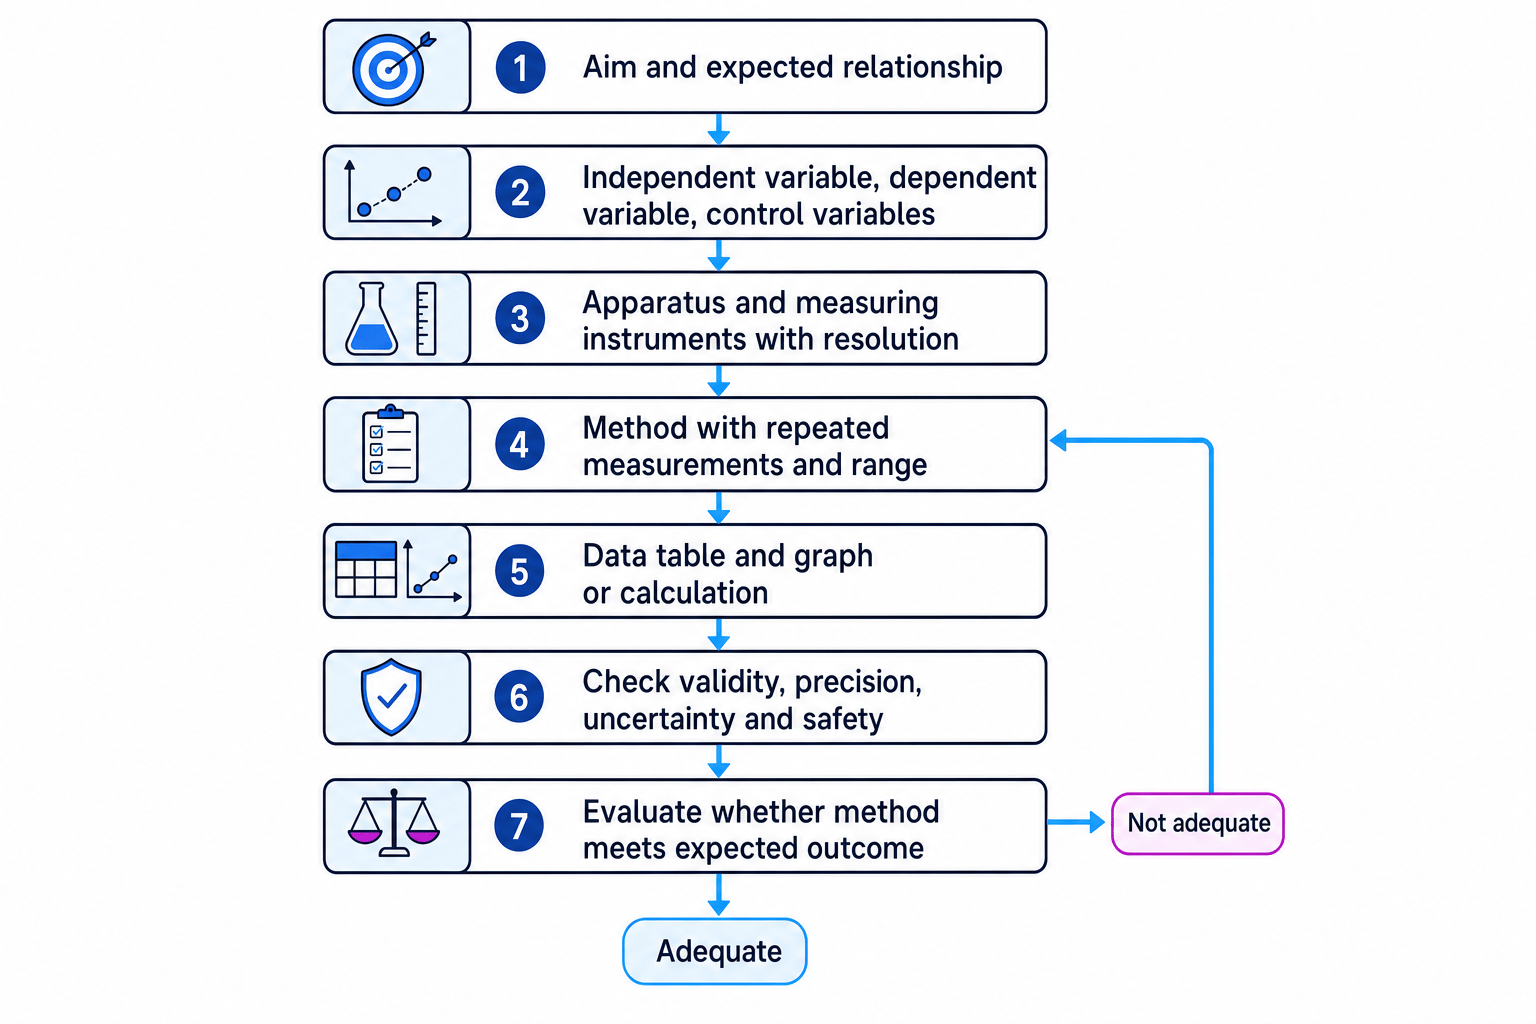
The planning process is a loop: if your proposed method cannot produce good enough evidence, you adjust the apparatus, measuring technique, or range of readings.
Start with the aim, model and variables
A good plan begins with the physics. Ask: What relationship am I testing, and what would I expect to see if the model is correct?
Aim, hypothesis and expected outcome
- The aim states what the experiment is designed to find out.
- A hypothesis is a testable prediction based on physics.
- The expected outcome is the pattern, graph shape, or numerical result you expect if the physics model is correct.
For example, if you are investigating resistance, the relevant model might be:
ρ=RAL\rho = \frac{RA}{L}ρ=LRAwhere ρ\rhoρ is resistivity in ohm metres, RRR is resistance in ohms, AAA is cross-sectional area in square metres, and LLL is length in metres. Rearranging the equation tells you what to measure and how to analyse it.
Variables
- The independent variable is the quantity you deliberately change.
- The dependent variable is the quantity you measure in response.
- A control variable is a quantity kept constant because it could otherwise affect the dependent variable.
Use the equation to design the experiment
If an equation can be rearranged into a straight-line form, your plan should usually include a graph. The independent variable goes on the horizontal axis, and the gradient can often be used to find a physical constant.
Choosing a practical method from a physics equation
A student wants to investigate the resistivity of a wire. The wire has approximate resistivity ρ=1.1×10⁻⁶ Ω m\rho = 1.1 \times 10^{-6}\ \Omega\,\text{m}ρ=1.1×10⁻⁶ Ωm and diameter d=0.45 mmd = 0.45\ \text{mm}d=0.45 mm.
-
Rearrange the resistivity equation to show the measurable relationship:
R=ρLAR = \frac{\rho L}{A}R=AρLSo a graph of RRR against LLL should be a straight line with gradient ρA\frac{\rho}{A}Aρ.
-
Estimate the cross-sectional area of the wire:
A=πd24=π(4.5×10⁻⁴ m)24=1.59×10⁻⁷ m2A = \frac{\pi d^2}{4} = \frac{\pi(4.5 \times 10^{-4}\ \text{m})^2}{4} = 1.59 \times 10^{-7}\ \text{m}^2A=4πd2=4π(4.5×10⁻⁴ m)2=1.59×10⁻⁷ m2 -
Estimate the resistance for L=1.00 mL = 1.00\ \text{m}L=1.00 m:
R=(1.1×10⁻⁶ Ω m)(1.00 m)1.59×10⁻⁷ m2=6.9 ΩR = \frac{(1.1 \times 10^{-6}\ \Omega\,\text{m})(1.00\ \text{m})}{1.59 \times 10^{-7}\ \text{m}^2} = 6.9\ \OmegaR=1.59×10⁻⁷ m2(1.1×10⁻⁶ Ωm)(1.00 m)=6.9 ΩFor L=0.20 mL = 0.20\ \text{m}L=0.20 m, the resistance would be about 1.4 Ω1.4\ \Omega1.4 Ω.
-
Use this estimate to choose apparatus: a metre rule can measure lengths from about 0.20 m0.20\ \text{m}0.20 m to 1.00 m1.00\ \text{m}1.00 m, a micrometer can measure the diameter, and a digital multimeter or voltmeter-ammeter method can measure resistances of a few ohms.
Control variables keep the test fair
A result is valid if the experiment really tests the intended relationship. Control variables help validity because they stop other effects from changing the dependent variable.
For the wire experiment above, useful control variables include:
- Material of the wire, because resistivity depends on material.
- Diameter of the wire, because RRR depends on AAA.
- Temperature of the wire, because resistance can change when the wire heats up.
You should also say how each variable is controlled. For temperature, you might use a low current and switch off the circuit between readings.
Listing controls without reasons
Do not just write “keep temperature constant” for every experiment. Link each control variable to the physics: explain why it affects the measurement and how you would keep it constant.
Choose suitable apparatus and technique
Apparatus means the physical equipment used in the experiment, such as a metre rule, balance, light gate, signal generator, or voltmeter. A technique is the way you use the apparatus to obtain reliable measurements.
An uncertainty is a stated estimate of the doubt in a measurement. Two important apparatus features affect uncertainty:
- Resolution: the smallest change an instrument can display or distinguish.
- Range: the span of values the instrument can measure.
A suitable instrument must have both enough range and fine enough resolution. A metre rule may be suitable for measuring 0.80 m, but not for measuring the diameter of a thin wire; a micrometer is more suitable for that.
Choosing a better timing technique
A pendulum has a period of about 1.2 s1.2\ \text{s}1.2 s. A student plans to time one oscillation using a stop-clock. Assume the total start-stop reaction-time uncertainty is about ±0.4 s\pm 0.4\ \text{s}±0.4 s.
-
Calculate the percentage uncertainty if only one oscillation is timed:
0.4 s1.2 s×100%=33%\frac{0.4\ \text{s}}{1.2\ \text{s}} \times 100\% = 33\%1.2 s0.4 s×100%=33%This is too large for a useful measurement.
-
Time 20 oscillations instead. The total time is approximately:
20×1.2 s=24 s20 \times 1.2\ \text{s} = 24\ \text{s}20×1.2 s=24 sThe percentage uncertainty becomes:
0.4 s24 s×100%=1.7%\frac{0.4\ \text{s}}{24\ \text{s}} \times 100\% = 1.7\%24 s0.4 s×100%=1.7% -
Divide the total time by 20 to find the period. The uncertainty in one period is approximately:
0.4 s20=0.02 s\frac{0.4\ \text{s}}{20} = 0.02\ \text{s}200.4 s=0.02 sTiming many oscillations is therefore a much better technique than timing one.
Instrument choice sanity check
Before choosing apparatus, estimate the size of the measurement. If the expected change is similar to the instrument resolution, the method is probably not good enough.
Plan the data you will collect
A strong method does not just say “take readings”. It should explain the pattern of readings.
You should normally plan to:
- take readings over a sensible range of the independent variable;
- use several different values, often five or more where practical;
- repeat measurements of the dependent variable;
- calculate a mean, which is the average of repeated readings;
- identify any anomalous result, meaning a reading that does not fit the pattern and may need checking.
Your data table should have headings with units, such as length / m or potential difference / V. Your graph should be planned before the experiment, because it affects what data you need.
The gradient of a graph is the change in the vertical quantity divided by the change in the horizontal quantity. The intercept is where the line crosses an axis. For example, from V=IRV = IRV=IR, a graph of VVV against III should have gradient RRR.
Plan the analysis before collecting data
A method is stronger if you can say exactly how the data will be used: for example, “plot RRR against LLL and determine ρ\rhoρ from the gradient”.
Evaluate whether the method is appropriate
Evaluation means judging the quality of the method. You are not just looking for “more accurate results”; you are deciding whether the method can meet the expected outcome.
Useful evaluation words are:
- Precision: repeated readings are close together.
- Accuracy: a measurement is close to the true value.
- Random error: unpredictable scatter in readings, reduced by repeats and a mean.
- Systematic error: a consistent shift in one direction, such as a zero error or calibration error.
- Validity: the method tests the intended relationship with relevant variables controlled.
An appropriate method should have a suitable range, manageable uncertainty, relevant controls, safe apparatus, and a clear analysis route.
Evaluating whether a spring method is suitable
A student wants to test whether extension is proportional to force. They plan to measure extension using a metre rule. Trial readings suggest extensions from 5 mm to 40 mm. Each position reading has uncertainty about ±1 mm\pm 1\ \text{mm}±1 mm.
-
Extension is found by subtracting two position readings, so the uncertainty in extension is approximately:
Δx=±2 mm\Delta x = \pm 2\ \text{mm}Δx=±2 mm -
For the smallest extension, 5 mm, the percentage uncertainty is:
2 mm5 mm×100%=40%\frac{2\ \text{mm}}{5\ \text{mm}} \times 100\% = 40\%5 mm2 mm×100%=40%This point is not very useful because the uncertainty is a large fraction of the measurement.
-
For the largest extension, 40 mm, the percentage uncertainty is:
2 mm40 mm×100%=5%\frac{2\ \text{mm}}{40\ \text{mm}} \times 100\% = 5\%40 mm2 mm×100%=5%This is much more useful, so the method could be improved by using larger safe loads, a spring with larger extensions, or a pointer and scale arrangement, while ensuring the elastic limit is not exceeded.
More repeats do not fix a bad method
Repeating readings can reduce random error, but it will not correct a systematic error, poor resolution, or a missing control variable.
Writing a complete plan
In an exam, a good planning answer usually includes:
- The aim and expected relationship.
- The independent and dependent variables.
- The control variables and how they are controlled.
- The apparatus, with suitable resolution or range where relevant.
- A clear method for taking repeated measurements.
- The graph or calculation used to reach the outcome.
- A brief evaluation of whether the method is suitable.
You do not need to write a perfect lab script, but your plan must be specific enough that another physicist could follow it and understand why it works.
In the exam
- Start from the physics relationship, not from a memorised practical recipe.
- Name what you change, what you measure, and what you keep constant.
- Specify apparatus carefully: “micrometer for diameter” is stronger than “measure the wire”.
- Include repeats, a mean, and the graph or calculation that gives the final result.
- Evaluate with a specific reason, such as uncertainty, range, validity, or systematic error.
Check yourself
- If you were investigating how the resistance of a wire depends on length, what would be the independent, dependent and control variables?
- Why is timing 20 oscillations usually better than timing one oscillation?
- A method gives very close repeated readings, but the instrument has a zero error. Which quality issue does this reveal?
