

What you'll learn
- The difference between free oscillations and forced oscillations.
- How damping changes the amplitude and energy of an oscillator.
- What resonance and natural frequency mean.
- How to interpret amplitude–driving frequency graphs and link them to real systems.
Starting point: what is oscillating?
An oscillation is a repeated motion about an equilibrium position. The equilibrium position is the position where the resultant force would be zero if the object were placed there at rest.
For simple harmonic motion from earlier in the topic, you met quantities such as:
- displacement, xxx: distance and direction from equilibrium, in metres.
- amplitude, AAA: maximum displacement from equilibrium, in metres.
- period, TTT: time for one complete oscillation, in seconds.
- frequency, fff: number of oscillations per second, in hertz (Hz).
The link between period and frequency is:
f=1Tf = \frac{1}{T}f=T1Amplitude
The amplitude, AAA, is the maximum displacement of an oscillator from its equilibrium position.
Free oscillations
A free oscillation happens when a system is displaced and then released, with no continuing external driving force making it oscillate.
For example, if you pull a mass on a spring downwards and let go, it oscillates freely. In the ideal model with no energy losses, it keeps oscillating with constant amplitude.
In real life, there is nearly always some resistance, so free oscillations usually become damped.
Natural frequency
The natural frequency, f0f_0f0, is the frequency at which a system oscillates freely after being displaced and released. It depends on the physical properties of the system, such as mass and stiffness.
For a mass–spring system undergoing SHM, the OCR formula for the period is:
T=2πmkT = 2\pi\sqrt{\frac{m}{k}}T=2πkmwhere mmm is the mass in kilograms and kkk is the spring constant in newtons per metre.
So the natural frequency is found using f0=1/Tf_0 = 1/Tf0=1/T.
Calculating a natural frequency
A mass of 0.250 kg0.250\ \text{kg}0.250 kg is attached to a spring with spring constant 18.0 N m−118.0\ \text{N m}^{-1}18.0 N m−1. Calculate the natural frequency of the mass–spring system.
-
Use the mass–spring period equation:
T=2πmkT = 2\pi\sqrt{\frac{m}{k}}T=2πkm -
Substitute the values, keeping SI units:
T=2π0.250 kg18.0 N m−1T = 2\pi\sqrt{\frac{0.250\ \text{kg}}{18.0\ \text{N m}^{-1}}}T=2π18.0 N m−10.250 kg -
Calculate the period:
T=0.740 sT = 0.740\ \text{s}T=0.740 s -
Convert period to frequency:
f0=1T=10.740 s=1.35 Hzf_0 = \frac{1}{T} = \frac{1}{0.740\ \text{s}} = 1.35\ \text{Hz}f0=T1=0.740 s1=1.35 Hz
So the system’s natural frequency is about 1.35 Hz1.35\ \text{Hz}1.35 Hz.
Forced oscillations
A forced oscillation happens when a periodic external force drives a system. The frequency of this external force is called the driving frequency.
For example:
- a child on a swing being pushed regularly,
- a loudspeaker cone driven by an alternating current,
- a bridge being forced by repeated footsteps or wind gusts,
- a mass–spring system attached to a mechanical vibrator.
In forced oscillations, the system eventually oscillates at the driving frequency, not necessarily at its own natural frequency. The amplitude depends strongly on how close the driving frequency is to the natural frequency.
Free vs forced
A free oscillator is set going and then left alone. A forced oscillator is continuously driven by an external periodic force.
Damping
Damping is about energy loss.
Damping
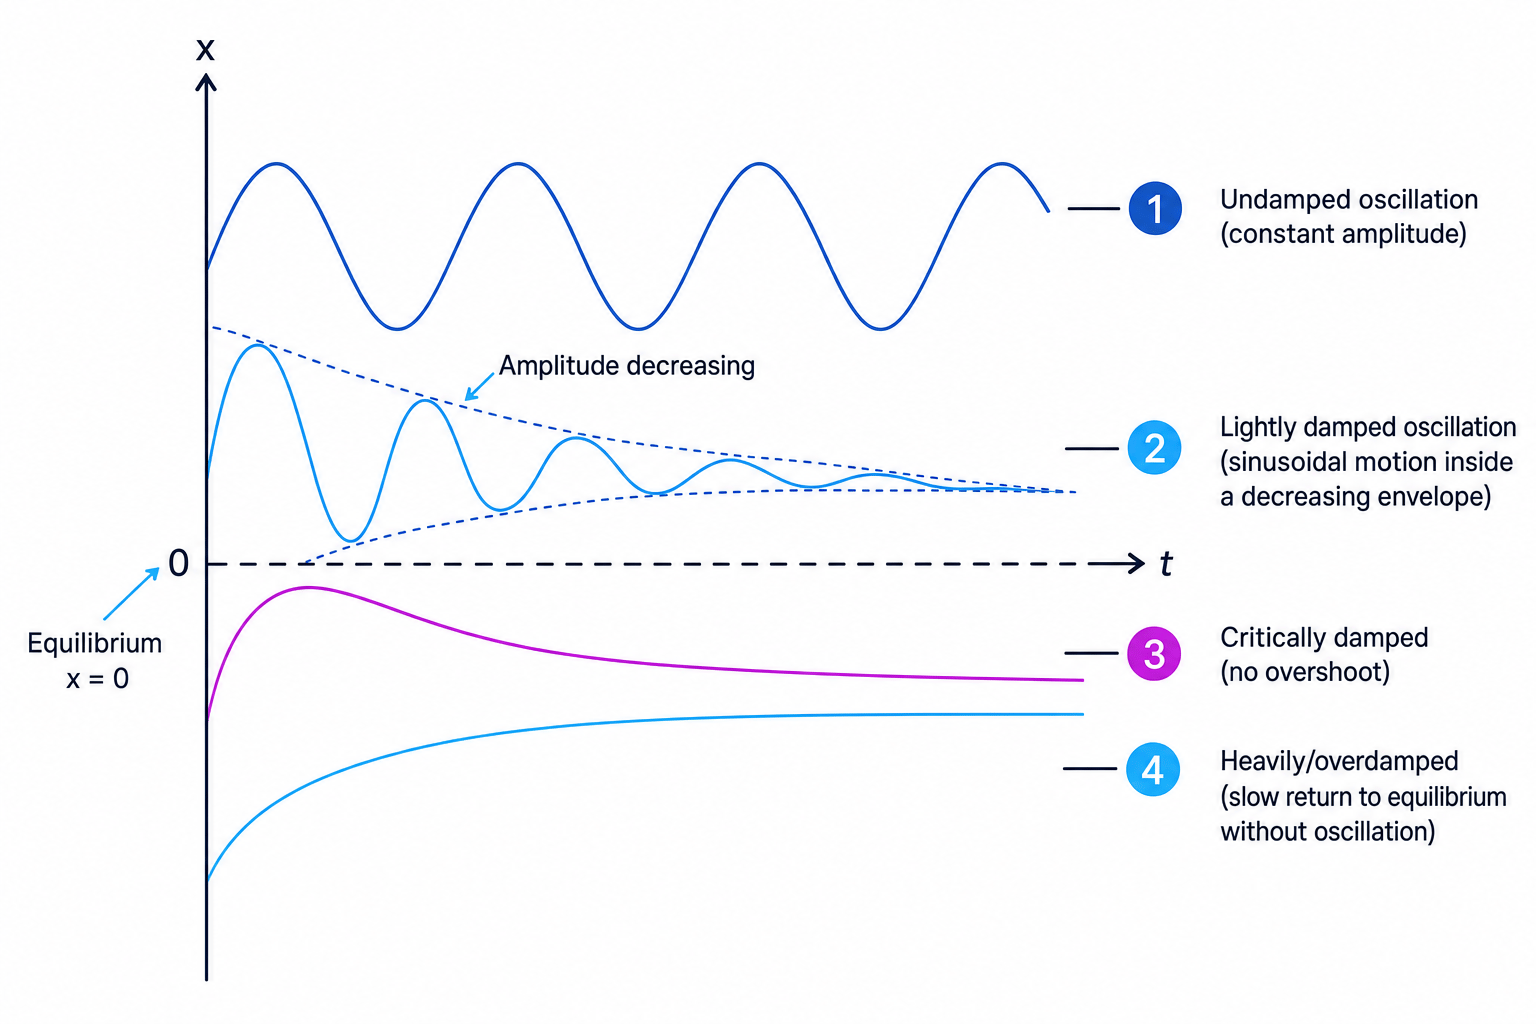
Damping is the removal of energy from an oscillating system by resistive forces, causing the amplitude of oscillation to decrease with time.
The resistive force might be due to air resistance, friction, viscosity in a liquid, or electromagnetic effects. The lost mechanical energy is usually transferred to thermal energy in the surroundings.
The main effects of damping are:
- the amplitude decreases with time,
- the total mechanical energy decreases with time,
- the oscillator may eventually come to rest at equilibrium,
- stronger damping removes energy more quickly.
Types of damping
Light damping means the system still oscillates, but the amplitude gradually decreases. A pendulum swinging in air is often lightly damped.
Critical damping means the system returns to equilibrium in the shortest possible time without oscillating. This is useful in car suspension and measuring instruments.
Heavy damping, also called overdamping, means the system returns to equilibrium without oscillating, but more slowly than with critical damping.
Mixing up critical and heavy damping
Critical damping is the fastest return to equilibrium without overshoot. Heavy damping also has no oscillation, but it returns more slowly.
Identifying damping behaviour
A mass on a spring is pulled down and released. In one liquid it oscillates several times with decreasing amplitude. In a thicker liquid it moves slowly back to equilibrium without crossing it.
-
For the first liquid, the motion still crosses the equilibrium position repeatedly, so the system is still oscillating.
-
Its amplitude decreases over time, so energy is being removed by damping.
-
This is light damping, because oscillations continue but gradually die away.
-
In the thicker liquid, there is no crossing of equilibrium and no oscillation, so the damping is much stronger.
-
Since the return is slow, it is best described as heavy damping rather than critical damping.
Observing damped oscillations
You can observe damped oscillations using several systems:
- a mass on a spring oscillating in air, water, or oil,
- a pendulum with a card attached to increase air resistance,
- a trolley between springs on a track,
- a vibrating ruler or strip clamped at one end.
A good practical method is to record displacement against time using a motion sensor, video analysis, or a ruler with a fixed reference point. You can then compare how the peak amplitudes change with time.
To make the comparison fair, keep the initial amplitude and the oscillator the same, then change only the damping, such as by using a thicker liquid or adding a larger card.
Practical clue
For damped oscillations, look at the peaks on a displacement–time graph. If successive peaks get smaller, energy is being dissipated.
Resonance
Resonance is one of the most important ideas in this section.
Resonance
Resonance occurs when a forced oscillator has a maximum, or very large, amplitude because the driving frequency is close to the natural frequency of the system.
At resonance, energy is transferred to the oscillator very efficiently. The amplitude grows until the rate of energy input from the driver equals the rate of energy loss due to damping.
This is why damping matters: without much damping, resonance can produce dangerously large amplitudes.
Condition for resonance
Resonance occurs when the driving frequency is close to the natural frequency of the oscillator.
Explaining resonance in a swing
A child on a swing has a natural frequency of about 0.50 Hz0.50\ \text{Hz}0.50 Hz. A parent pushes the swing once every 2.0 seconds. Explain why the amplitude grows.
-
Convert the pushing interval into a driving frequency:
f=1T=12.0 s=0.50 Hzf = \frac{1}{T} = \frac{1}{2.0\ \text{s}} = 0.50\ \text{Hz}f=T1=2.0 s1=0.50 Hz -
Compare the driving frequency with the natural frequency:
f=0.50 Hz,f0=0.50 Hzf = 0.50\ \text{Hz}, \quad f_0 = 0.50\ \text{Hz}f=0.50 Hz,f0=0.50 Hz -
Since the driving frequency matches the natural frequency, the swing is being driven at resonance.
-
Energy is transferred efficiently each cycle, so the amplitude increases until damping losses balance the energy input.
Amplitude–driving frequency graphs
For a forced oscillator, you can vary the driving frequency and measure the steady amplitude. The graph of amplitude against driving frequency is called an amplitude–frequency graph or resonance curve.
The key pattern is:
- at very low driving frequency, the amplitude is usually relatively small,
- the amplitude rises to a maximum near the natural frequency,
- after resonance, the amplitude falls again at higher driving frequencies,
- more damping makes the peak lower and broader.
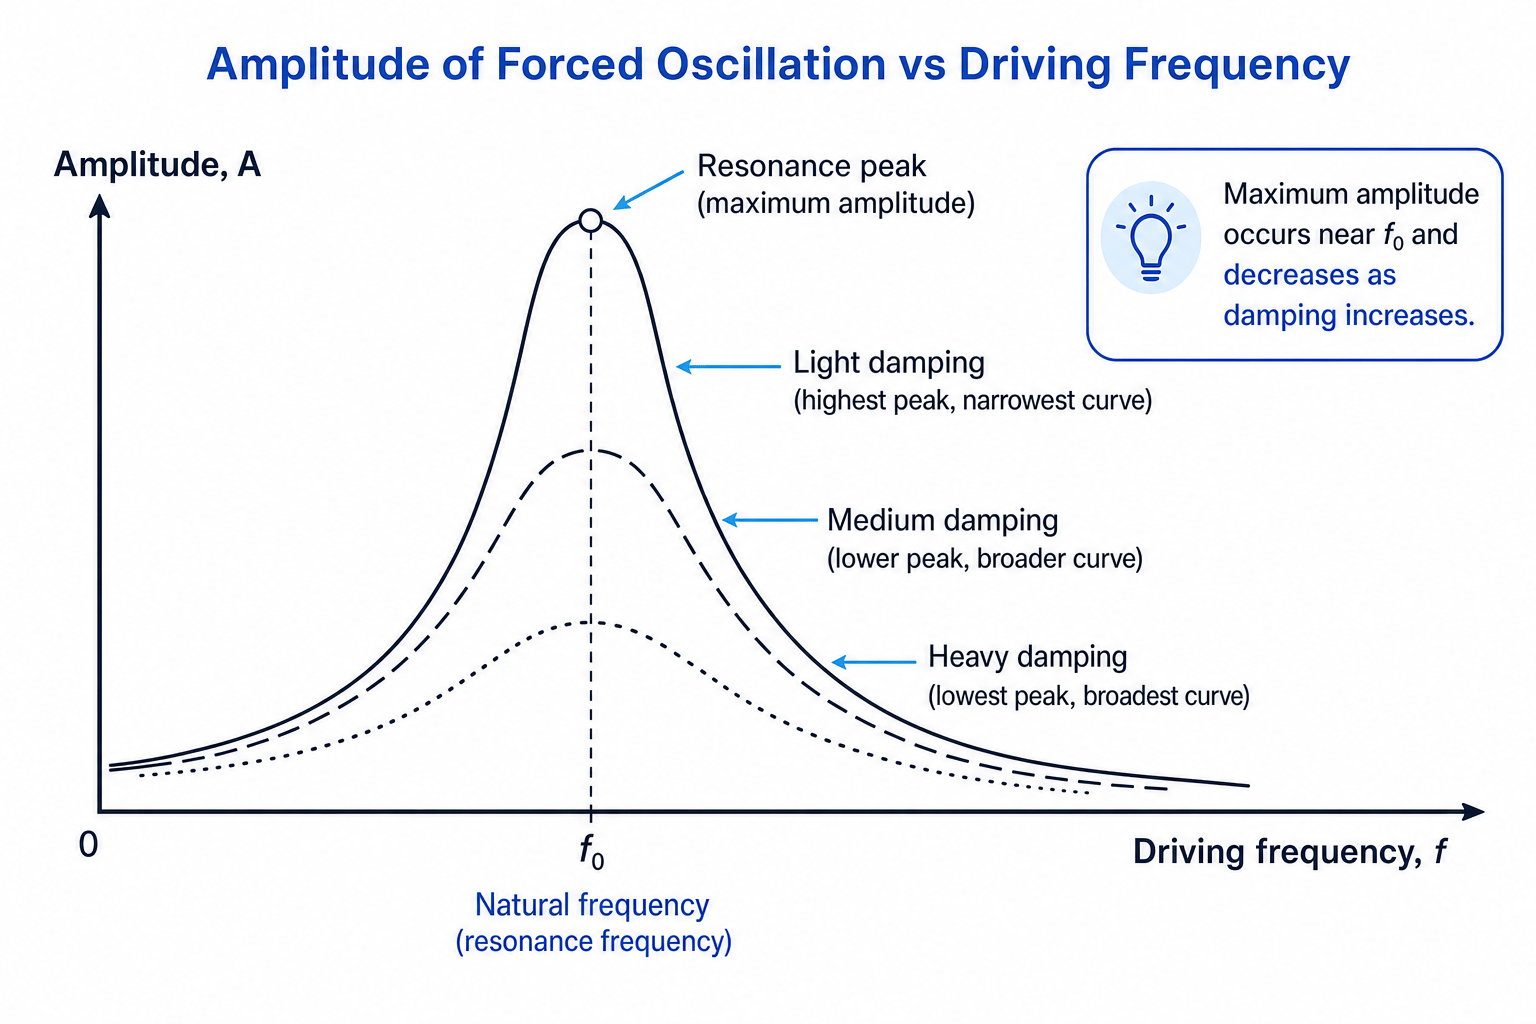
With light damping, the resonance peak is tall and narrow. This means the system is very sensitive to being driven near its natural frequency.
With heavy damping, the peak is much lower and wider. This means the maximum amplitude is smaller, and resonance is less dramatic.
Peak position on real graphs
For light damping, it is usually fine to say resonance occurs close to the natural frequency. With stronger damping, the maximum can be shifted slightly below the undamped natural frequency, so use the graph if one is given.
Interpreting a resonance curve
A forced oscillator is tested at different driving frequencies. The largest measured amplitude is 46 mm at 3.2 Hz3.2\ \text{Hz}3.2 Hz. After extra damping is added, the largest amplitude is only 18 mm and the peak spreads over a wider range of frequencies.
-
The resonance frequency is found from the largest amplitude, so it is approximately 3.2 Hz3.2\ \text{Hz}3.2 Hz before the extra damping is added.
-
Adding damping reduces the maximum amplitude from 46 mm to 18 mm, showing that energy is being dissipated more rapidly.
-
The broader peak means the oscillator responds less sharply to one particular driving frequency.
-
The extra damping makes resonance less severe, which is often useful for safety and control.
Practical examples of forced oscillations and resonance
Resonance can be useful, inconvenient, or dangerous depending on the situation.
Useful examples include:
- musical instruments, where strings or air columns resonate at particular frequencies,
- microwave cavities and antennas, where electromagnetic oscillations are designed to respond strongly at chosen frequencies,
- playground swings, where timed pushes increase amplitude efficiently.
Dangerous or unwanted examples include:
- bridges vibrating due to marching soldiers, traffic, or wind,
- buildings vibrating during earthquakes,
- machine parts shaking when a motor speed matches a natural frequency,
- washing machines vibrating strongly during spin cycles if the load is uneven.
Engineers reduce unwanted resonance by:
- adding damping,
- changing the natural frequency by altering mass or stiffness,
- avoiding driving frequencies near the natural frequency.
Engineering idea
To reduce resonance problems, either reduce the peak using damping or move the natural frequency away from the driving frequency.
In the exam
- Define terms precisely: free oscillation means no continuous driving force; forced oscillation means an external periodic force is applied.
- For damping questions, mention both decreasing amplitude and energy dissipation.
- On resonance graphs, identify the maximum amplitude, compare damping from peak height and width, and state that resonance occurs near the natural frequency.
Check yourself
- What is the difference between a free oscillation and a forced oscillation?
- Why does damping reduce the amplitude of an oscillator?
- How does increasing damping change the shape of an amplitude–driving frequency graph?
