

What you'll learn
- How the Sun and other stars produce continuous spectra with dark absorption lines.
- Why stars are treated as very good black-body radiators.
- How to use Wien’s displacement law, Stefan’s law and the inverse square law to find stellar properties.
- Why observing the same object at many wavelengths reveals different physical processes.
Prerequisite ideas: radiation and spectra
Stars send out electromagnetic radiation: waves such as radio waves, infrared, visible light, ultraviolet, X-rays and gamma rays. Each part of the electromagnetic spectrum has a different wavelength, the distance between matching points on neighbouring waves.
A spectrum is a display of intensity against wavelength, or simply a spread-out record of which wavelengths are present.
Spectrum
A spectrum shows the wavelengths of electromagnetic radiation emitted, absorbed or transmitted by a source.
At A-Level you should also connect wavelength to photon energy: higher frequency means higher photon energy, using E=hfE = hfE=hf. So short-wavelength ultraviolet and X-ray photons are more energetic than long-wavelength infrared or radio photons.
Stellar spectra: continuous light plus absorption lines
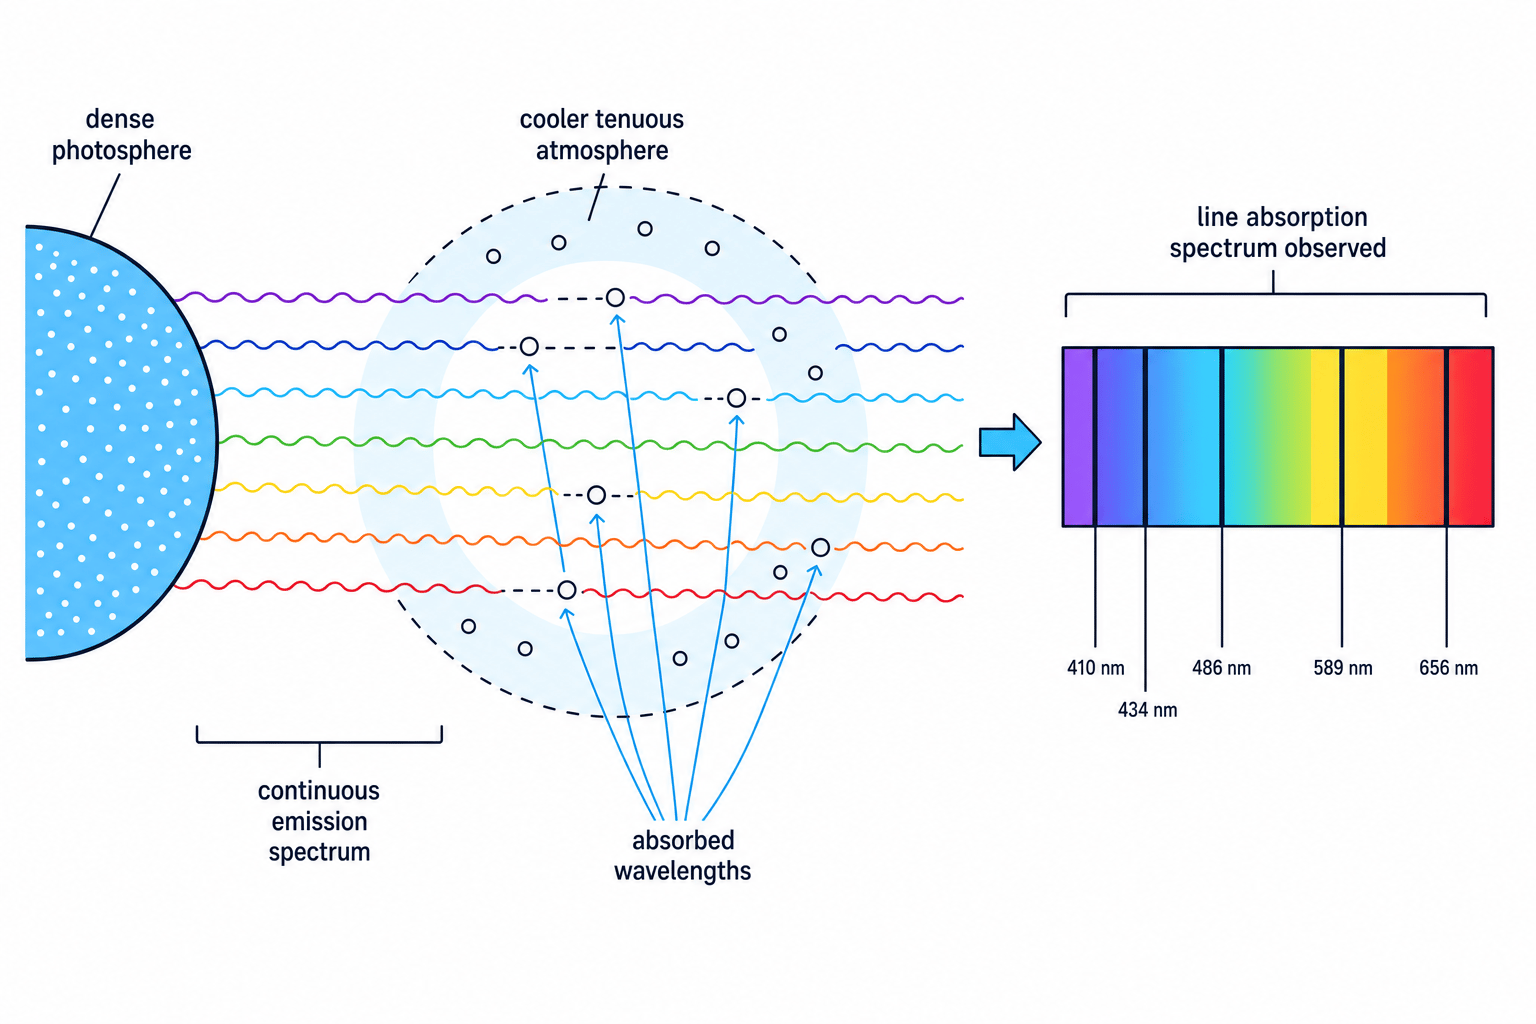
A star is not a solid glowing ball. Its visible “surface” is a dense layer of hot gas, often called the photosphere. Because it is dense and hot, it emits a broad range of wavelengths: this is a continuous emission spectrum.
Outside this dense surface is a cooler, thinner, more tenuous stellar atmosphere. “Tenuous” means low density. As the radiation passes through it, atoms and ions absorb photons at very specific wavelengths, corresponding to energy changes in their electrons. Those missing wavelengths appear as dark lines in the observed spectrum.
What a stellar spectrum tells you
A stellar spectrum is usually a continuous emission spectrum from the dense hot surface, crossed by dark absorption lines produced by the cooler, tenuous atmosphere of the star.
The pattern of absorption lines is like a fingerprint. Different elements absorb different wavelengths, so astronomers can identify gases in the star’s atmosphere.
Identifying gases from absorption lines
A star shows dark lines at 410 nm, 434 nm, 486 nm and 656 nm, and a further dark line at 589 nm.
-
Compare the first four wavelengths with laboratory spectra. These match prominent hydrogen absorption wavelengths, so hydrogen is present in the star’s atmosphere.
-
Compare the 589 nm line with laboratory data. A strong absorption line near 589 nm is associated with sodium, so sodium is also present.
-
Use the fact that the lines are dark. This means the absorbing gas lies in front of a brighter continuous source, so the lines are caused by the cooler stellar atmosphere rather than by a separate glowing gas cloud.
Black bodies and stars
A black body is an ideal object that absorbs all incident radiation, whatever the wavelength. It is also the best possible emitter of radiation for its temperature.
Black body
A black body absorbs all the electromagnetic radiation incident on it. Its emitted spectrum depends only on its absolute temperature.
Real stars are not perfect black bodies, because absorption lines and other details are present. However, their overall continuous spectra are very close to black-body spectra, so black-body laws are extremely useful for estimating stellar temperatures, radii and luminosities.
The black-body spectrum
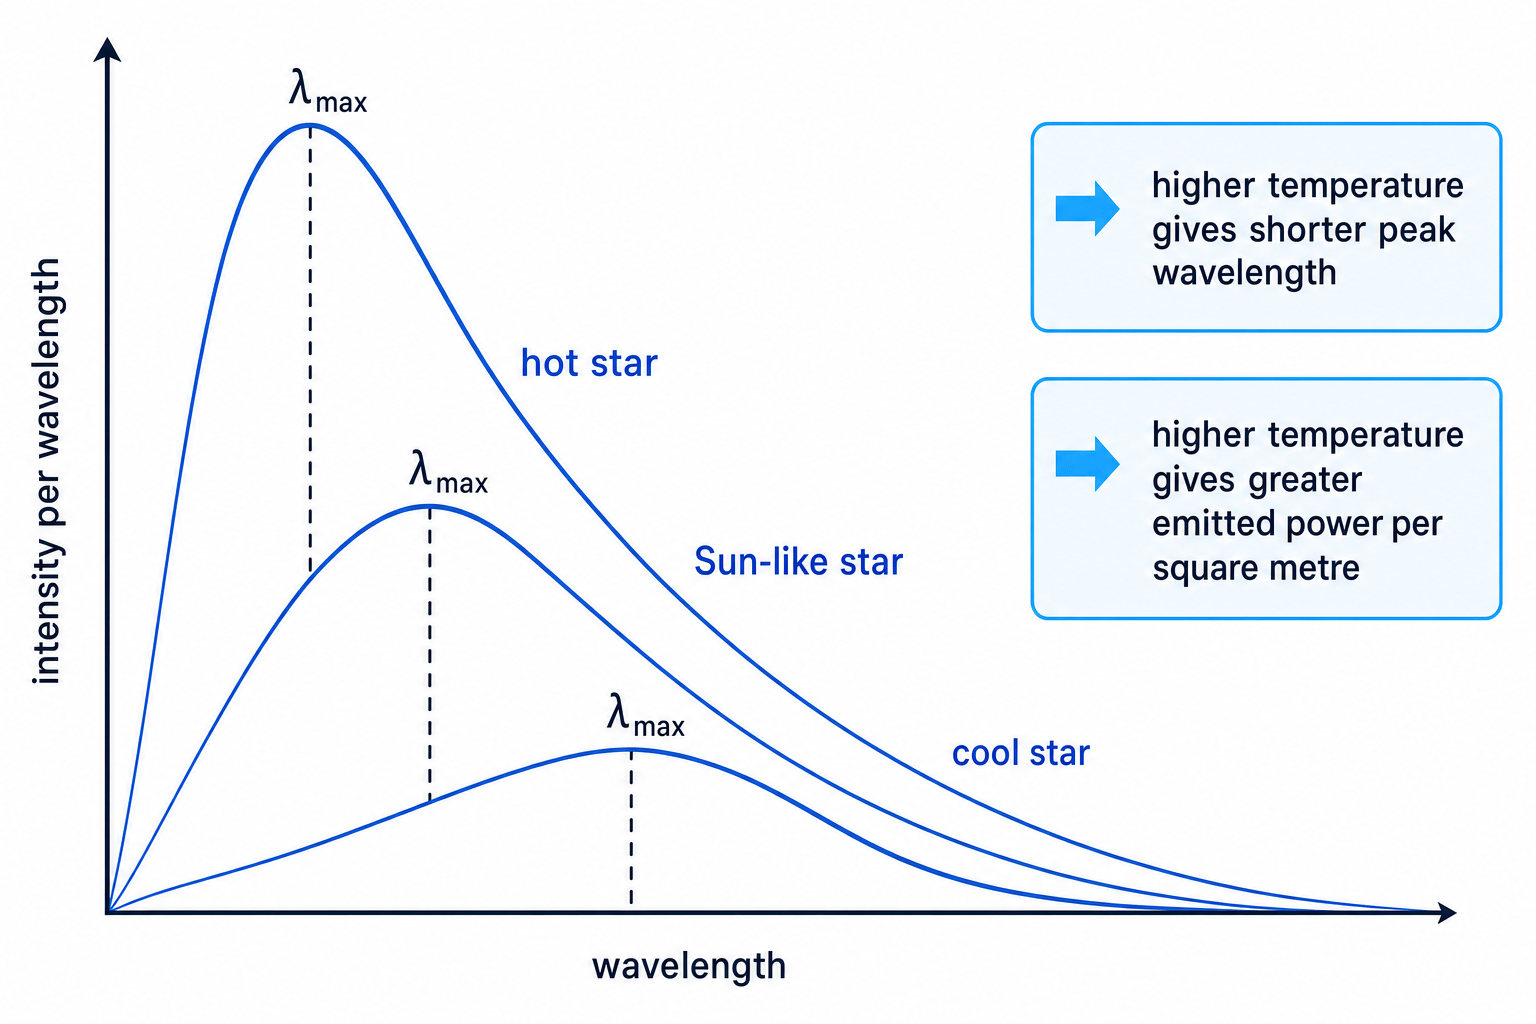
A black-body spectrum has a smooth “hump” shape. It is not equally bright at all wavelengths. The wavelength where the intensity is greatest is called the peak wavelength, written λmax\lambda_{\max}λmax.
As temperature increases:
- the peak shifts to shorter wavelengths;
- the whole curve rises, so more power is emitted per square metre;
- the total area under the curve increases.
Absolute temperature
Absolute temperature is measured in kelvin (K). For a Celsius temperature θ\thetaθ, the conversion is T(K)=θ(∘C)+273.15T(\text{K}) = \theta(^{\circ}\text{C}) + 273.15T(K)=θ(∘C)+273.15.
The peak wavelength is inversely proportional to absolute temperature. This is Wien’s displacement law:
λmaxT=2.90×10⁻³ m K\lambda_{\max}T = 2.90 \times 10^{-3}\ \text{m K}λmaxT=2.90×10⁻³ m KSo hotter stars have smaller λmax\lambda_{\max}λmax values and often appear bluer; cooler stars have larger λmax\lambda_{\max}λmax values and often appear redder.
Finding surface temperature from peak wavelength
A star’s black-body curve peaks at 500 nm500\ \text{nm}500 nm. Estimate its surface temperature.
-
Convert the wavelength into metres: 500 nm=500×10−9 m=5.00×10⁻⁷ m500\ \text{nm} = 500 \times 10^{-9}\ \text{m} = 5.00 \times 10^{-7}\ \text{m}500 nm=500×10−9 m=5.00×10⁻⁷ m.
-
Rearrange Wien’s law: T=2.90×10⁻³ m KλmaxT = \frac{2.90 \times 10^{-3}\ \text{m K}}{\lambda_{\max}}T=λmax2.90×10−3 m K.
-
Substitute and calculate: T=2.90×10⁻³ m K5.00×10−7 m=5.80×10³ KT = \frac{2.90 \times 10^{-3}\ \text{m K}}{5.00 \times 10^{-7}\ \text{m}} = 5.80 \times 10^{3}\ \text{K}T=5.00×10⁻⁷ m2.90×10−3 m K=5.80×10³ K.
Using degrees Celsius in radiation laws
Wien’s law and Stefan’s law require temperature in kelvin. Never substitute a Celsius temperature into these equations.
Luminosity, size and distance
A star’s luminosity, LLL, is the total power it emits in all directions. It is measured in watts (W).
The flux, FFF, received from a star is the power arriving per unit area at the observer. It is measured in watts per square metre, W m^-2. Some questions may call this received intensity or apparent brightness; the physics is the same.
Luminosity and flux
Luminosity is total power emitted by a star. Flux is power received per unit area at a distance from the star.
Stefan’s law
Stefan’s law links luminosity to surface area and temperature:
L=σAT4L = \sigma A T^4L=σAT4For a spherical star of radius RRR, the surface area is A=4πR2A = 4\pi R^2A=4πR2, so:
L=4πR2σT4L = 4\pi R^2\sigma T^4L=4πR2σT4where σ=5.67×10⁻⁸ W m−2 K−4\sigma = 5.67 \times 10^{-8}\ \text{W m}^{-2}\ \text{K}^{-4}σ=5.67×10⁻⁸ W m−2 K−4 is the Stefan constant.
This tells you that luminosity depends very strongly on temperature, because of the fourth power. A small increase in temperature can cause a large increase in emitted power.
The inverse square law
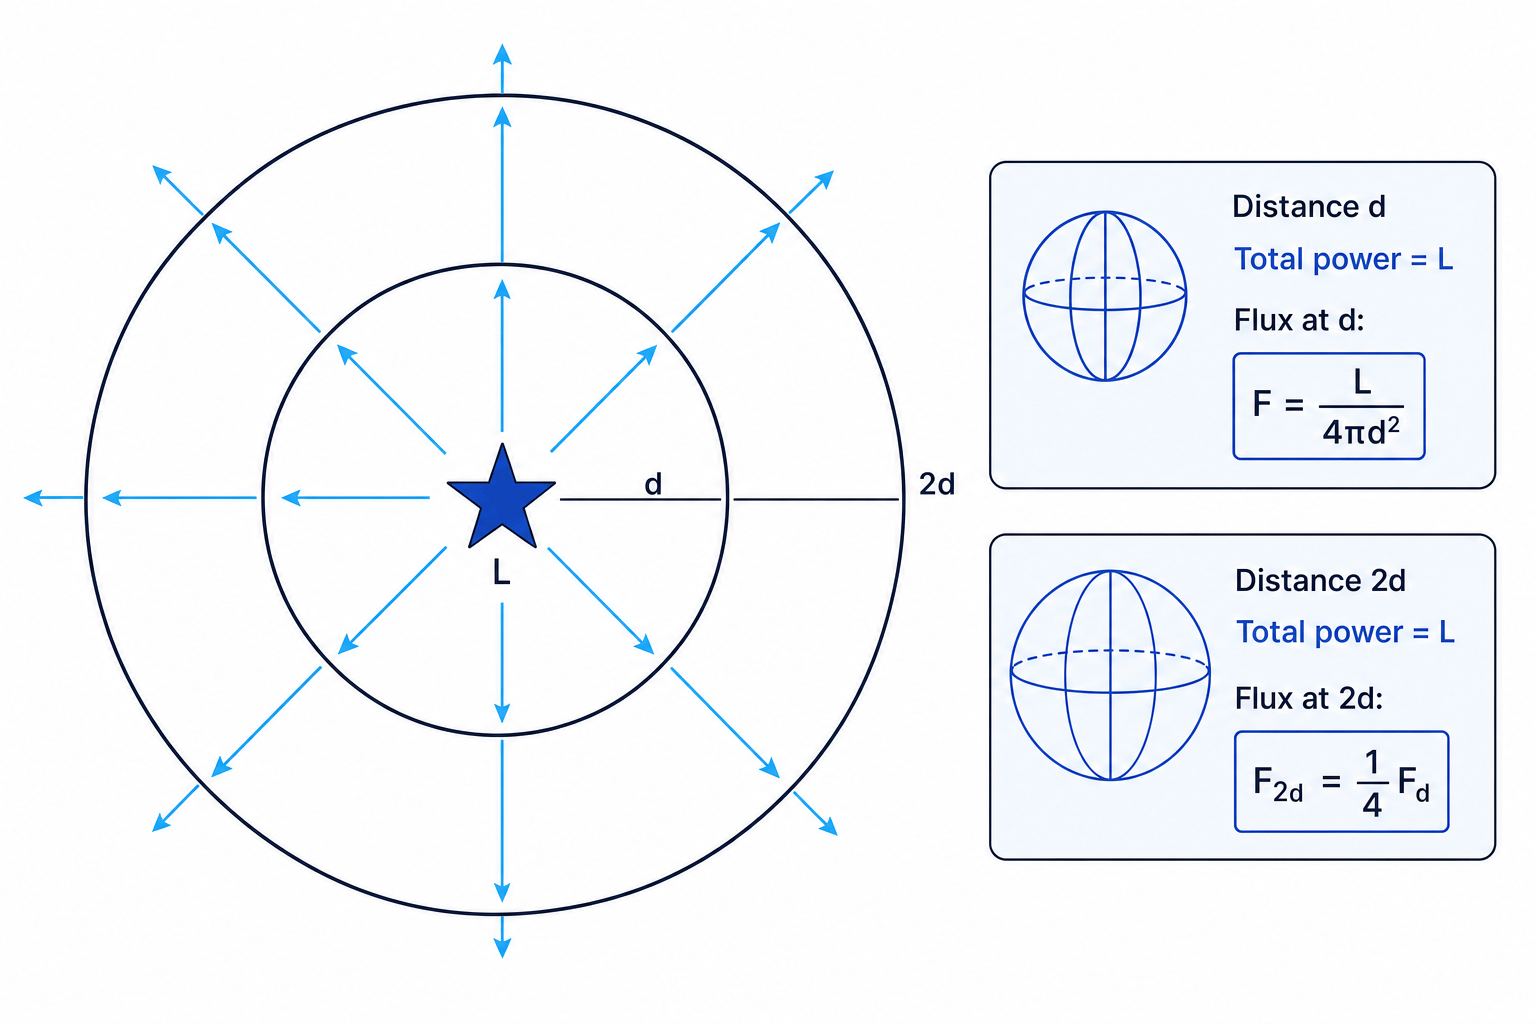
As light travels away from a star, the same total luminosity is spread over the surface area of a larger and larger sphere. The surface area of a sphere is proportional to d2d^2d2, so flux follows an inverse square law:
F=L4πd2F = \frac{L}{4\pi d^2}F=4πd2Lwhere ddd is the distance from the star.
The full stellar method
A spectrum gives temperature using Wien’s law. Flux and distance give luminosity using the inverse square law. Luminosity and temperature then give radius using Stefan’s law.
Finding stellar radius from observations
A star has peak wavelength 400 nm400\ \text{nm}400 nm. Its flux at Earth is 1.20×10⁻⁸ W m−21.20 \times 10^{-8}\ \text{W m}^{-2}1.20×10⁻⁸ W m−2 and its distance is 1.50×10¹⁷ m1.50 \times 10^{17}\ \text{m}1.50×10¹⁷ m. Estimate its radius.
-
Use Wien’s law to find the temperature. Since 400 nm=4.00×10⁻⁷ m400\ \text{nm} = 4.00 \times 10^{-7}\ \text{m}400 nm=4.00×10⁻⁷ m, T=2.90×10⁻³ m K4.00×10−7 m=7.25×10³ KT = \frac{2.90 \times 10^{-3}\ \text{m K}}{4.00 \times 10^{-7}\ \text{m}} = 7.25 \times 10^{3}\ \text{K}T=4.00×10⁻⁷ m2.90×10−3 m K=7.25×10³ K.
-
Use the inverse square law to find luminosity: L=4πd2F=4π(1.50×10¹⁷ m)2(1.20×10⁻⁸ W m−2)=3.39×1027 WL = 4\pi d^2F = 4\pi(1.50 \times 10^{17}\ \text{m})^2(1.20 \times 10^{-8}\ \text{W m}^{-2}) = 3.39 \times 10^{27}\ \text{W}L=4πd2F=4π(1.50×10¹⁷ m)2(1.20×10⁻⁸ W m−2)=3.39×1027 W.
-
Rearrange Stefan’s law for radius: R=L4πσT4=3.39×1027 W4π(5.67×10⁻⁸ W m−2 K−4)(7.25×10³ K)4=1.3×10⁹ mR = \sqrt{\frac{L}{4\pi\sigma T^4}} = \sqrt{\frac{3.39 \times 10^{27}\ \text{W}}{4\pi(5.67 \times 10^{-8}\ \text{W m}^{-2}\ \text{K}^{-4})(7.25 \times 10^3\ \text{K})^4}} = 1.3 \times 10^9\ \text{m}R=4πσT4L=4π(5.67×10⁻⁸ W m−2 K−4)(7.25×10³ K)43.39×1027 W=1.3×10⁹ m.
Confusing star radius with distance
In Stefan’s law, RRR is the star’s physical radius. In the inverse square law, ddd is the distance from the star to the observer. They are very different quantities.
Observational and data-analysis points
In practice, astronomers measure intensity at many wavelengths using a calibrated detector. Calibration matters because the detector, telescope and Earth’s atmosphere may not transmit all wavelengths equally.
The peak of a black-body curve can be broad, so λmax\lambda_{\max}λmax has uncertainty. Since T∝1λmaxT \propto \frac{1}{\lambda_{\max}}T∝λmax1, the percentage uncertainty in TTT is approximately the same as the percentage uncertainty in λmax\lambda_{\max}λmax.
Useful graph tests
For Stefan’s law, plotting emitted power per unit area against T4T^4T4 should give a straight line with gradient σ\sigmaσ. For the inverse square law, plotting flux against 1d2\frac{1}{d^2}d21 should give a straight line through the origin.
Multiwavelength astronomy
Multiwavelength astronomy means observing the same region of space using different parts of the electromagnetic spectrum. This matters because different wavelengths reveal different temperatures, energies and physical processes.
For example:
- radio waves can reveal cold gas clouds;
- infrared can reveal cool dust and forming stars hidden from visible light;
- visible light shows many ordinary stars clearly;
- ultraviolet is linked to very hot young stars;
- X-rays and gamma rays reveal very energetic processes, such as hot gas, supernova remnants or material near compact objects.
Choosing wavelengths for a star-forming region
Astronomers want to study a dusty star-forming cloud.
-
Use visible observations to map bright stars outside the densest dust, while noticing that some regions look dark because dust absorbs visible light.
-
Use infrared observations because longer wavelengths pass through dust more easily and can reveal cool protostars embedded inside the cloud.
-
Compare with radio data to map cold gas, then use the combined evidence to build a clearer picture of where stars are forming and what material is available.
In the exam
-
Check which quantity the question is asking for: temperature, luminosity, radius, flux or distance.
-
Convert wavelengths into metres and temperatures into kelvin before substituting into radiation laws.
-
For star-size questions, combine equations in the right order: Wien for TTT, inverse square for LLL, then Stefan for RRR.
-
Do not use stellar magnitudes here; Eduqas does not require brightness in magnitudes for this section.
Check yourself
- Why do stellar spectra contain dark absorption lines rather than only a smooth continuous spectrum?
- A star’s peak wavelength is smaller than the Sun’s. What does that tell you about its surface temperature?
- How could you use flux, distance and temperature measurements to estimate a star’s radius?
