

What you'll learn
- How light behaves as discrete energy packets called photons.
- How the photoelectric effect gives evidence for photons and lets you measure electron energies.
- How line spectra reveal atomic energy levels.
- How de Broglie waves and photon momentum lead to electron diffraction and radiation pressure.
1. Starting point: light as waves and as photons
You already know that light is an electromagnetic wave, so for any region of the electromagnetic spectrum:
c=fλc = f\lambdac=fλwhere ccc is the speed of light in a vacuum, fff is frequency, and λ\lambdaλ is wavelength. In this topic, you add a particle-like model: light arrives in individual packets.
Photon
A photon is a discrete packet of electromagnetic radiation. Its energy is given by E=hfE = hfE=hf, or equivalently E=hcλE = \frac{hc}{\lambda}E=λhc, where hhh is the Planck constant.
A higher frequency means a larger photon energy. A shorter wavelength also means a larger photon energy.
Electronvolt
The electronvolt (eV) is an energy unit. 1 eV is the energy transferred to an electron when it moves through a potential difference of 1 V. So 1 eV = 1.60×10⁻¹⁹ J1.60 \times 10^{-19} \text{ J}1.60×10⁻¹⁹ J.
Calculating photon energy from wavelength
Violet light has wavelength 400 nm. Find the photon energy in joules and electronvolts.
-
Convert the wavelength into metres: 400 nm=4.00×10⁻⁷ m400 \text{ nm} = 4.00 \times 10^{-7} \text{ m}400 nm=4.00×10⁻⁷ m.
-
Use E=hcλE = \frac{hc}{\lambda}E=λhc:
E=(6.63×10⁻³⁴ J s)(3.00×10⁸ m s−1)4.00×10⁻⁷ m=4.97×10⁻¹⁹ JE = \frac{(6.63 \times 10^{-34} \text{ J s})(3.00 \times 10^8 \text{ m s}^{-1})}{4.00 \times 10^{-7} \text{ m}} = 4.97 \times 10^{-19} \text{ J}E=4.00×10⁻⁷ m(6.63×10⁻³⁴ J s)(3.00×10⁸ m s−1)=4.97×10⁻¹⁹ J -
Convert to electronvolts:
E=4.97×10⁻¹⁹ J1.60×10−19 J eV−1=3.11 eVE = \frac{4.97 \times 10^{-19} \text{ J}}{1.60 \times 10^{-19} \text{ J eV}^{-1}} = 3.11 \text{ eV}E=1.60×10⁻¹⁹ J eV−14.97×10⁻¹⁹ J=3.11 eV
2. The photoelectric effect
The photoelectric effect is the emission of electrons from a metal surface when electromagnetic radiation of high enough frequency shines on it.
A simple demonstration uses a clean zinc plate connected to a negatively charged gold-leaf electroscope. Ultraviolet radiation makes the leaf fall because electrons are emitted from the zinc, so the electroscope loses negative charge. Visible light does not do this, even if it is intense.
Work function and threshold frequency
The work function, ϕ\phiϕ, is the minimum energy needed for an electron to escape from a metal surface. The threshold frequency, f0f_0f0, is the minimum frequency needed for emission, so ϕ=hf0\phi = hf_0ϕ=hf0.
The key observations are:
- Below the threshold frequency, no electrons are emitted.
- Above the threshold frequency, emission is effectively immediate.
- Increasing intensity increases the number of emitted electrons per second, but not their maximum kinetic energy.
- Increasing frequency increases the maximum kinetic energy of the emitted electrons.
Why photons explain the photoelectric effect
One photon transfers its energy to one electron. If hf<ϕhf < \phihf<ϕ, the electron cannot escape, no matter how intense the light is.
3. Measuring electron energy with a vacuum photocell
A vacuum photocell contains a metal cathode and an anode inside an evacuated tube. Monochromatic light, meaning light of one frequency, shines on the cathode and releases photoelectrons. The photocurrent is the current due to these emitted electrons reaching the anode.
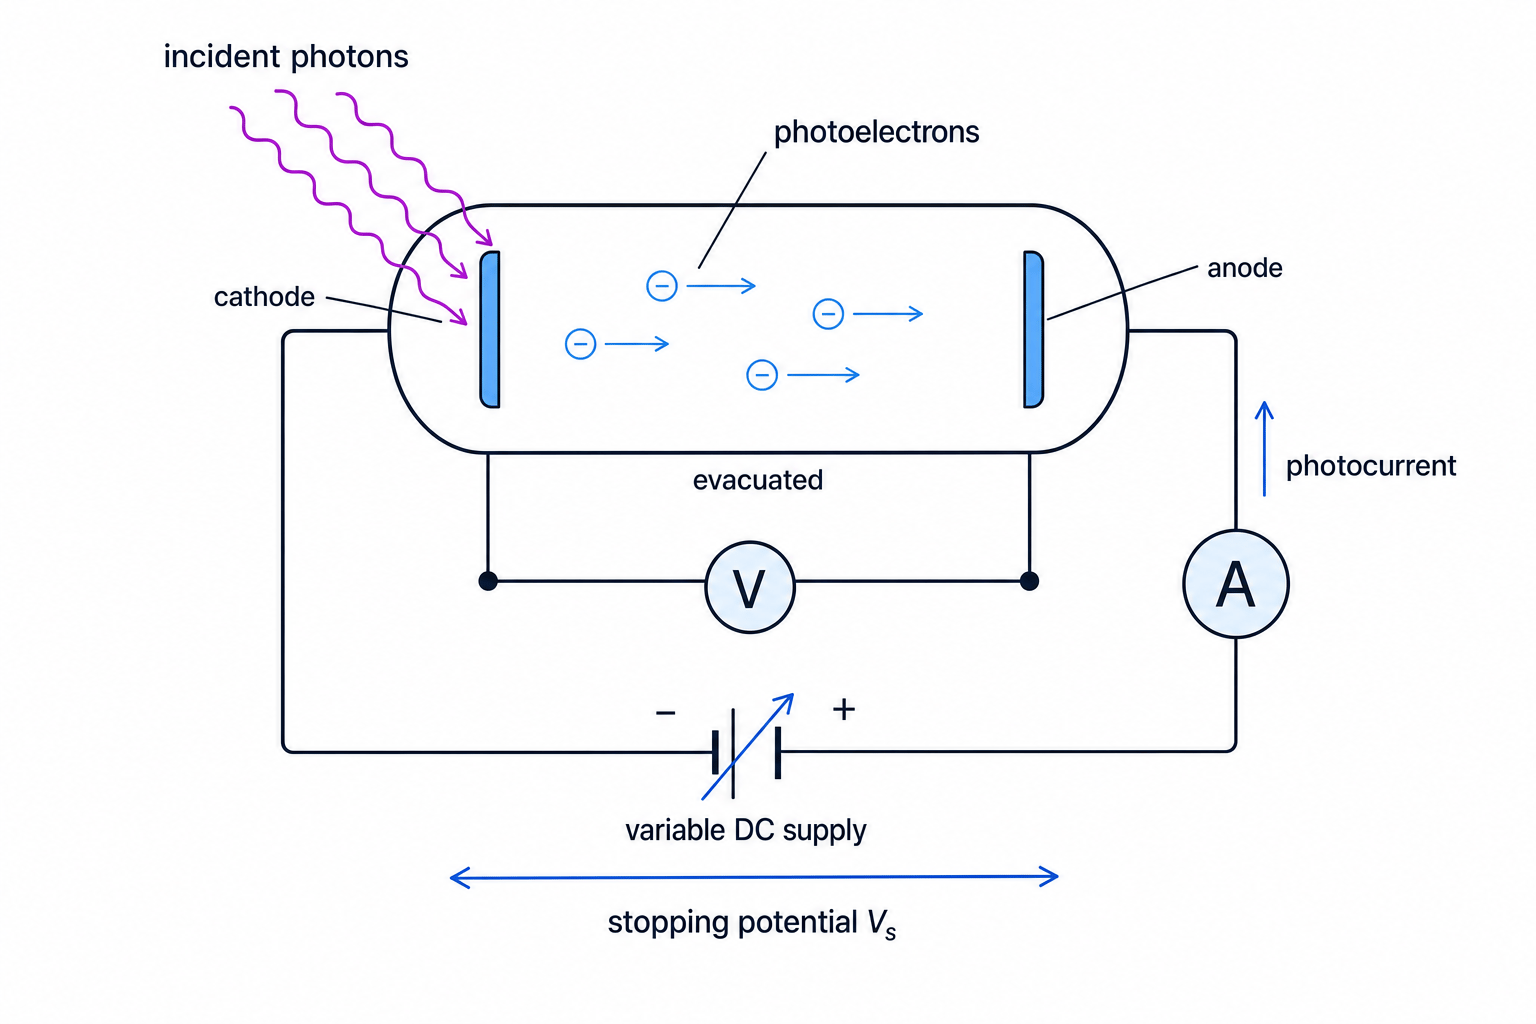
If the anode is made negative relative to the cathode, it repels electrons. The stopping potential, VsV_sVs, is the potential difference just large enough to reduce the photocurrent to zero. At this point, even the fastest electrons are stopped.
Ek max=eVsE_{k \text{ max}} = eV_sEk max=eVsIn joules, multiply by the elementary charge e=1.60×10⁻¹⁹ Ce = 1.60 \times 10^{-19} \text{ C}e=1.60×10⁻¹⁹ C. In electronvolts, the numerical value of Ek maxE_{k \text{ max}}Ek max is the same as VsV_sVs in volts.
Using a stopping potential
A photocell current falls to zero when the stopping potential is 1.85 V. Find Ek maxE_{k \text{ max}}Ek max in eV and J.
-
Use the electronvolt shortcut: a stopping potential of 1.85 V means Ek max=1.85 eVE_{k \text{ max}} = 1.85 \text{ eV}Ek max=1.85 eV.
-
Convert to joules using 1 eV = 1.60×10⁻¹⁹ J1.60 \times 10^{-19} \text{ J}1.60×10⁻¹⁹ J:
Ek max=1.85×1.60×10−19 JE_{k \text{ max}} = 1.85 \times 1.60 \times 10^{-19} \text{ J}Ek max=1.85×1.60×10−19 J -
Quote the result sensibly:
Ek max=2.96×10⁻¹⁹ JE_{k \text{ max}} = 2.96 \times 10^{-19} \text{ J}Ek max=2.96×10⁻¹⁹ J
4. Einstein’s photoelectric equation and the graph
Einstein’s photon model gives:
hf=ϕ+Ek maxhf = \phi + E_{k \text{ max}}hf=ϕ+Ek maxor
Ek max=hf−ϕE_{k \text{ max}} = hf - \phiEk max=hf−ϕThis is a straight-line equation for a graph of Ek maxE_{k \text{ max}}Ek max against frequency fff.
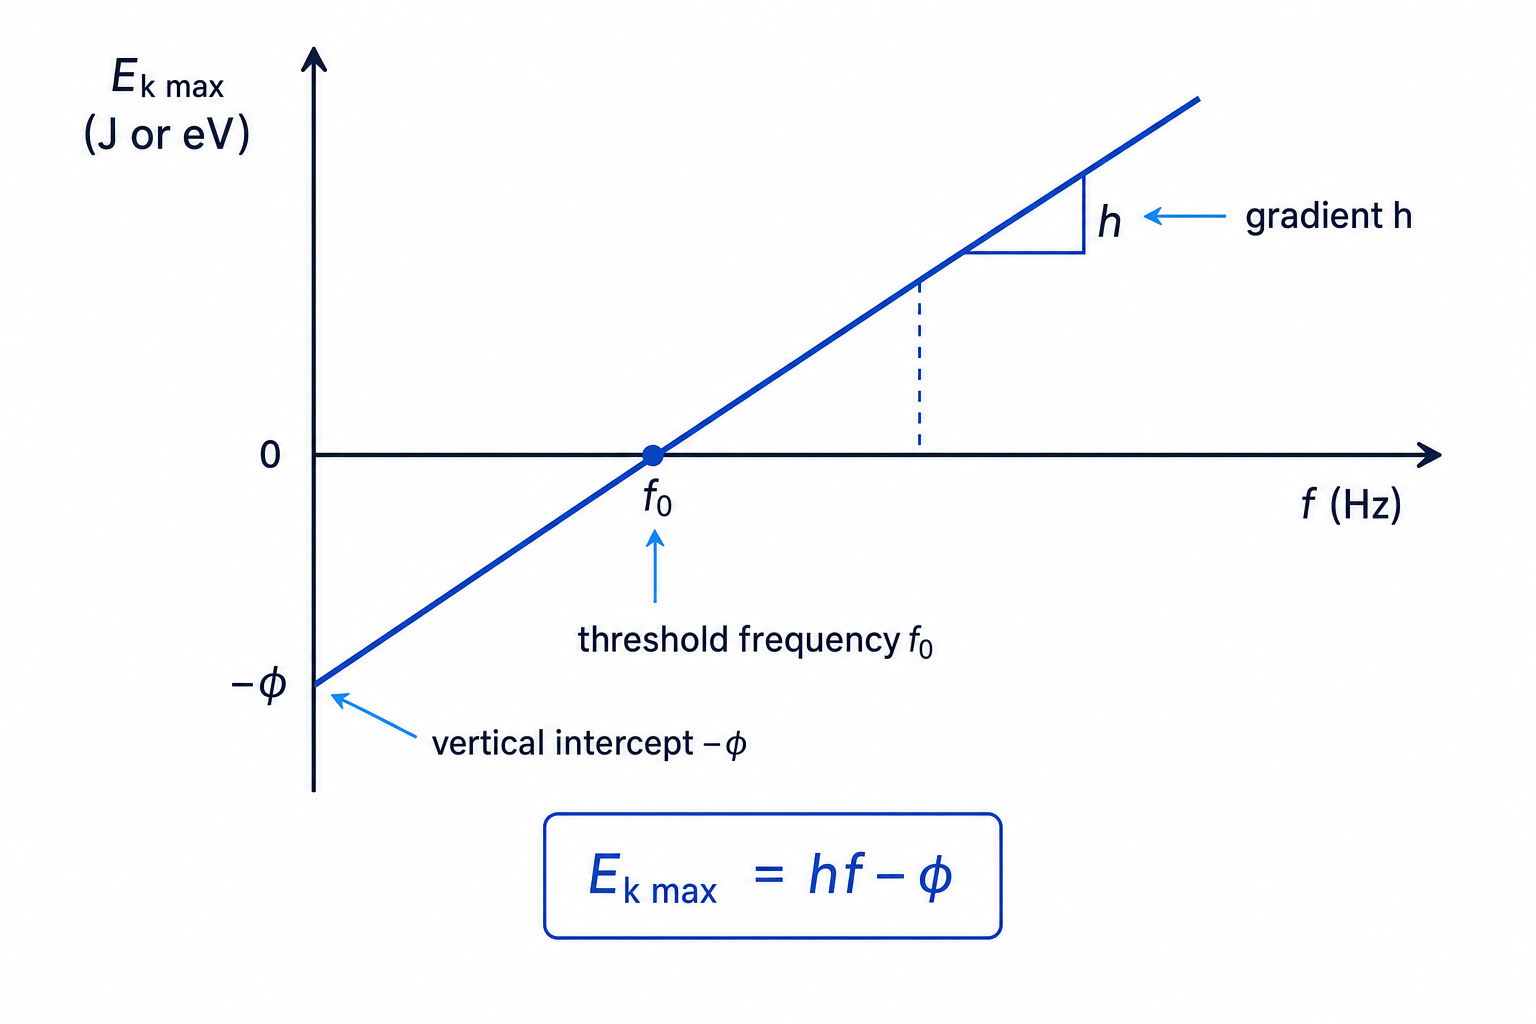
On this graph:
- Gradient = hhh.
- Vertical intercept = −ϕ-\phi−ϕ.
- Horizontal intercept = f0f_0f0, the threshold frequency.
- The line only has physical meaning for f≥f0f \ge f_0f≥f0.
Interpreting a photoelectric graph
A metal has threshold frequency 5.0×10¹⁴ Hz5.0 \times 10^{14} \text{ Hz}5.0×10¹⁴ Hz. Radiation of frequency 8.0×10¹⁴ Hz8.0 \times 10^{14} \text{ Hz}8.0×10¹⁴ Hz is incident. Find the work function and the maximum kinetic energy.
-
Calculate the work function:
ϕ=hf0=(6.63×10⁻³⁴ J s)(5.0×10¹⁴ Hz)=3.32×10⁻¹⁹ J\phi = hf_0 = (6.63 \times 10^{-34} \text{ J s})(5.0 \times 10^{14} \text{ Hz}) = 3.32 \times 10^{-19} \text{ J}ϕ=hf0=(6.63×10⁻³⁴ J s)(5.0×10¹⁴ Hz)=3.32×10⁻¹⁹ J -
Use Ek max=h(f−f0)E_{k \text{ max}} = h(f - f_0)Ek max=h(f−f0):
Ek max=(6.63×10⁻³⁴)(3.0×10¹⁴)=1.99×10⁻¹⁹ JE_{k \text{ max}} = (6.63 \times 10^{-34})(3.0 \times 10^{14}) = 1.99 \times 10^{-19} \text{ J}Ek max=(6.63×10⁻³⁴)(3.0×10¹⁴)=1.99×10⁻¹⁹ J -
Convert the kinetic energy to electronvolts:
Ek max=1.99×10−191.60×10−19=1.24 eVE_{k \text{ max}} = \frac{1.99 \times 10^{-19}}{1.60 \times 10^{-19}} = 1.24 \text{ eV}Ek max=1.60×10−191.99×10−19=1.24 eV
Changing intensity
For light above the threshold frequency, increasing intensity increases the photocurrent, not Ek maxE_{k \text{ max}}Ek max. Maximum kinetic energy depends on frequency.
5. Determining the Planck constant using LEDs
In the specified practical, you estimate hhh using light emitting diodes, or LEDs. An LED emits photons when charge carriers lose energy in the diode. A useful approximation is:
eV≈hcλeV \approx \frac{hc}{\lambda}eV≈λhcSo:
V≈hce1λV \approx \frac{hc}{e}\frac{1}{\lambda}V≈ehcλ1Set up a circuit with a variable DC supply, a series resistor, an LED, an ammeter, and a voltmeter across the LED. LEDs are polarised components, so connect them the correct way round. For several LEDs of known wavelength, find a turn-on voltage using a consistent method, such as extrapolating the steep part of the I–V graph back to the voltage axis.
Plot VVV on the y-axis against 1λ\frac{1}{\lambda}λ1 on the x-axis. The gradient is approximately hce\frac{hc}{e}ehc, so:
h=e×gradientch = \frac{e \times \text{gradient}}{c}h=ce×gradientFinding Planck’s constant from an LED graph
An LED practical gives a gradient of 1.20×10⁻⁶ V m1.20 \times 10^{-6} \text{ V m}1.20×10⁻⁶ V m for a graph of VVV against 1λ\frac{1}{\lambda}λ1. Estimate hhh.
-
Use h=e×gradientch = \frac{e \times \text{gradient}}{c}h=ce×gradient.
-
Substitute values:
h=(1.60×10⁻¹⁹ C)(1.20×10⁻⁶ V m)3.00×10⁸ m s−1h = \frac{(1.60 \times 10^{-19} \text{ C})(1.20 \times 10^{-6} \text{ V m})}{3.00 \times 10^8 \text{ m s}^{-1}}h=3.00×10⁸ m s−1(1.60×10⁻¹⁹ C)(1.20×10⁻⁶ V m) -
Since C V is J:
h=6.40×10⁻³⁴ J sh = 6.40 \times 10^{-34} \text{ J s}h=6.40×10⁻³⁴ J s
LED practical uncertainty
The LED does not switch on at one perfectly sharp voltage, and each LED emits a range of wavelengths. Use the same voltage-finding method for every LED and draw a best-fit line.
6. Photon energies across the electromagnetic spectrum
The visible spectrum runs approximately from 700 nm at the red end to 400 nm at the violet end. Red photons have lower energy than violet photons.
Typical orders of magnitude are:
- Radio waves: wavelengths from metres to kilometres; photon energies below about 10−5 eV10^{-5} \text{ eV}10−5 eV.
- Microwaves: wavelengths around 1 mm to 0.1 m; photon energies around 10−510^{-5}10−5 to 10−3 eV10^{-3} \text{ eV}10−3 eV.
- Infrared: wavelengths from 700 nm to 1 mm; photon energies roughly 10−310^{-3}10−3 to 2 eV.
- Visible: 700 nm to 400 nm; photon energies roughly 1.8 eV to 3.1 eV.
- Ultraviolet: about 10 nm to 400 nm; photon energies roughly 3 eV to 100 eV.
- X-rays: about 0.01 nm to 10 nm; photon energies roughly 100 eV to 100 keV.
- Gamma rays: wavelengths below about 0.01 nm; photon energies above about 100 keV.
7. Line spectra and atomic energy levels
Atoms have quantised energy levels, meaning electrons in atoms can only have certain allowed energies. A low-pressure gas discharge excites atoms; when electrons fall to lower energy levels, photons are emitted. This produces a line emission spectrum: bright lines at specific wavelengths.
A line absorption spectrum is produced when continuous light passes through a cooler gas. Atoms absorb photons with exactly the right energies to raise electrons to higher levels, leaving dark lines in the continuous spectrum.
A diffraction grating separates the wavelengths. Emission spectra appear as sharp bright lines on a dark background. Absorption spectra appear as sharp dark lines across a continuous spectrum.
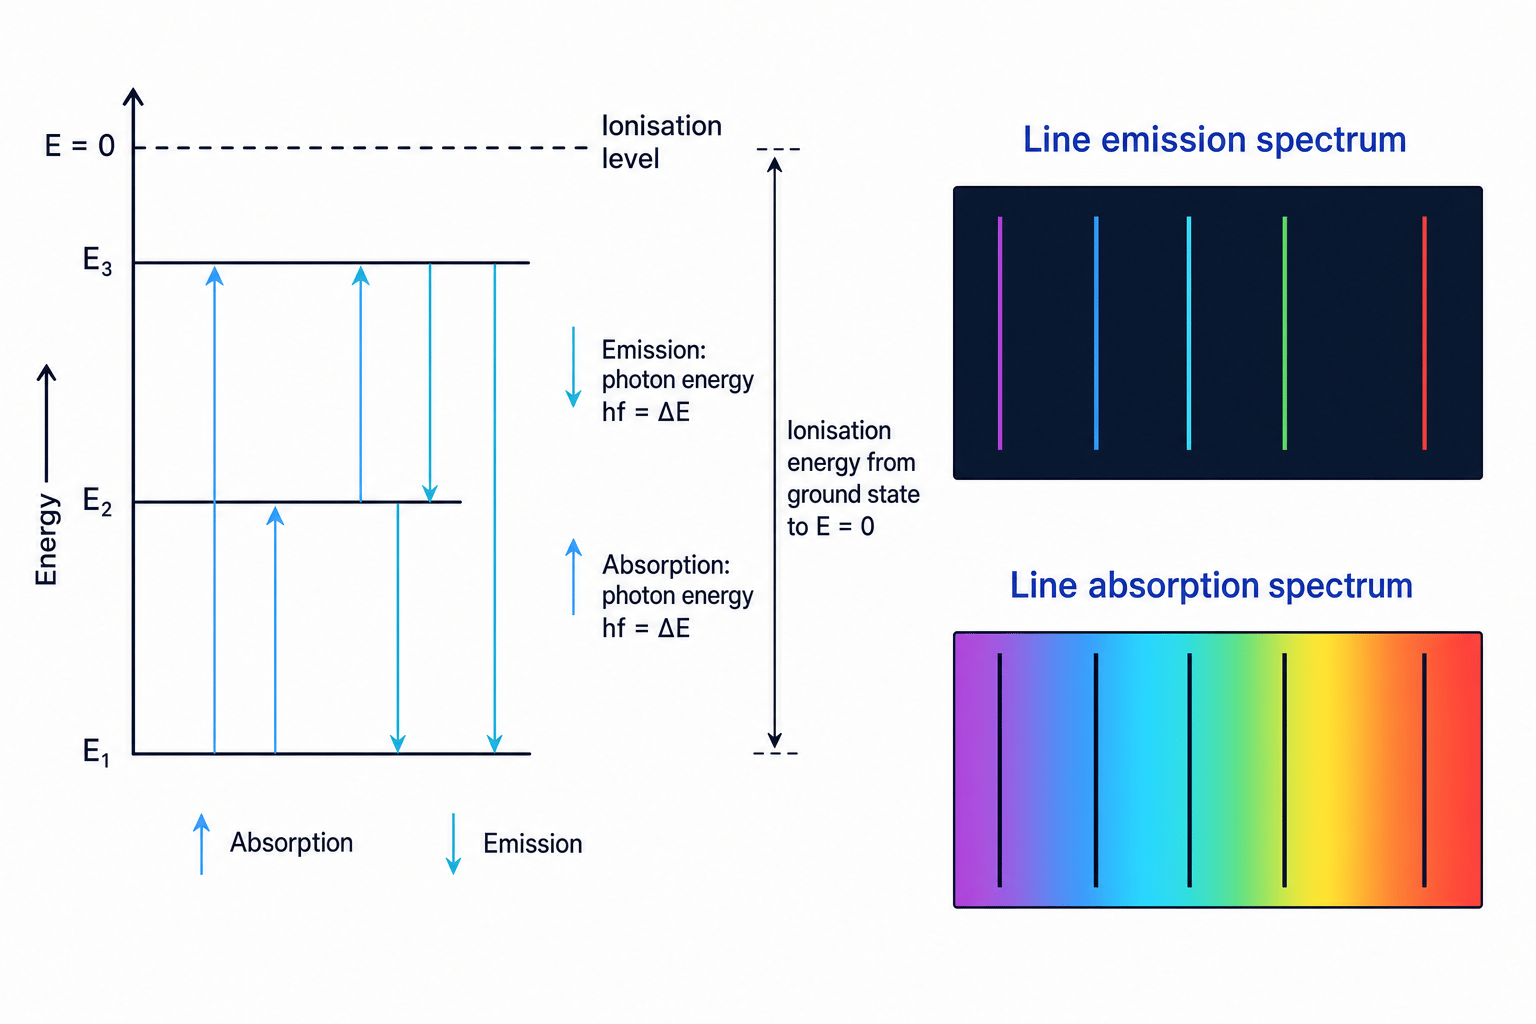
For a transition between two levels:
hf=ΔEhf = \Delta Ehf=ΔEThe ionisation energy is the energy needed to remove an electron completely from the atom, usually from the ground state to the level labelled E=0E = 0E=0.
Using energy levels
An atom has energy levels at -5.0 eV and -1.5 eV. An electron falls from -1.5 eV to -5.0 eV. Find the emitted photon wavelength and the ionisation energy from the ground state.
-
Find the energy gap:
ΔE=(−1.5)−(−5.0)=3.5 eV\Delta E = (-1.5) - (-5.0) = 3.5 \text{ eV}ΔE=(−1.5)−(−5.0)=3.5 eV -
Convert to joules and use λ=hcE\lambda = \frac{hc}{E}λ=Ehc:
E=3.5×1.60×10−19=5.60×10⁻¹⁹ JE = 3.5 \times 1.60 \times 10^{-19} = 5.60 \times 10^{-19} \text{ J}E=3.5×1.60×10−19=5.60×10⁻¹⁹ J λ=(6.63×10⁻³⁴)(3.00×10⁸)5.60×10−19=3.55×10⁻⁷ m\lambda = \frac{(6.63 \times 10^{-34})(3.00 \times 10^8)}{5.60 \times 10^{-19}} = 3.55 \times 10^{-7} \text{ m}λ=5.60×10⁻¹⁹(6.63×10⁻³⁴)(3.00×10⁸)=3.55×10⁻⁷ m -
The ionisation energy from the ground state is:
0−(−5.0)=5.0 eV=8.0×10⁻¹⁹ J0 - (-5.0) = 5.0 \text{ eV} = 8.0 \times 10^{-19} \text{ J}0−(−5.0)=5.0 eV=8.0×10⁻¹⁹ J
8. Electron diffraction and de Broglie waves
Electron diffraction shows that particles have a wave-like aspect. In the demonstration, electrons are accelerated in a vacuum towards a thin graphite target. The electrons form rings on a fluorescent screen, just as waves diffract through regularly spaced atomic layers.
de Broglie relationship
The de Broglie relationship is p=hλp = \frac{h}{\lambda}p=λh, where ppp is momentum and λ\lambdaλ is the de Broglie wavelength. It applies to particles of matter and also to photons.
If the electron accelerating voltage increases, the electrons gain more momentum, so their de Broglie wavelength decreases. The diffraction rings become smaller.
Calculating a de Broglie wavelength
An electron of mass 9.11×10⁻³¹ kg9.11 \times 10^{-31} \text{ kg}9.11×10⁻³¹ kg travels at 1.50×10⁷ m s−11.50 \times 10^7 \text{ m s}^{-1}1.50×10⁷ m s−1. Find its de Broglie wavelength.
-
Calculate momentum using p=mvp = mvp=mv:
p=(9.11×10⁻³¹)(1.50×10⁷)=1.37×10⁻²³ kg m s−1p = (9.11 \times 10^{-31})(1.50 \times 10^7) = 1.37 \times 10^{-23} \text{ kg m s}^{-1}p=(9.11×10⁻³¹)(1.50×10⁷)=1.37×10⁻²³ kg m s−1 -
Use λ=hp\lambda = \frac{h}{p}λ=ph:
λ=6.63×10−341.37×10−23=4.84×10⁻¹¹ m\lambda = \frac{6.63 \times 10^{-34}}{1.37 \times 10^{-23}} = 4.84 \times 10^{-11} \text{ m}λ=1.37×10−236.63×10−34=4.84×10⁻¹¹ m -
This is around the scale of atomic spacings, so diffraction is observable.
9. Radiation pressure
Photons carry momentum. When photons hit a surface, their momentum changes, so the surface experiences a force. Force per unit area is pressure.
For radiation normally incident on a surface with intensity III:
- Absorbing surface: prad=Icp_{\text{rad}} = \frac{I}{c}prad=cI
- Perfectly reflecting surface: prad=2Icp_{\text{rad}} = \frac{2I}{c}prad=c2I
Reflection gives twice the pressure because the photon momentum reverses direction.
Calculating radiation pressure
Sunlight of intensity 1.4×10³ W m−21.4 \times 10^3 \text{ W m}^{-2}1.4×10³ W m−2 falls normally on a perfectly reflecting solar sail of area 20 m220 \text{ m}^220 m2. Find the force.
-
Use the reflecting-surface pressure equation:
prad=2Icp_{\text{rad}} = \frac{2I}{c}prad=c2I -
Substitute the intensity:
prad=2(1.4×10³)3.00×108=9.3×10⁻⁶ Pap_{\text{rad}} = \frac{2(1.4 \times 10^3)}{3.00 \times 10^8} = 9.3 \times 10^{-6} \text{ Pa}prad=3.00×1082(1.4×10³)=9.3×10⁻⁶ Pa -
Use F=pradAF = p_{\text{rad}}AF=pradA:
F=(9.3×10⁻⁶)(20)=1.9×10⁻⁴ NF = (9.3 \times 10^{-6})(20) = 1.9 \times 10^{-4} \text{ N}F=(9.3×10⁻⁶)(20)=1.9×10⁻⁴ N
In the exam
- Convert carefully: nm to m, eV to J, and stopping potential in V to electron energy in eV.
- For photoelectric graphs, link each feature to the equation: gradient hhh, intercept −ϕ-\phi−ϕ, threshold frequency f0f_0f0.
- For spectra, use energy gaps: downward transitions emit photons, upward transitions absorb photons, and ionisation goes to E=0E = 0E=0.
Check yourself
- Why does increasing light intensity below the threshold frequency still produce no photoelectrons?
- How would you use a graph from an LED practical to estimate the Planck constant?
- Why does a reflected photon exert twice the radiation pressure of an absorbed photon?
