Question 69
100 students completed a puzzle, their times are summarised by summary data and the box plot.
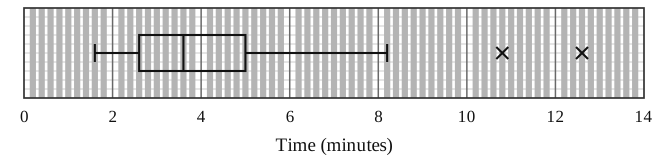
Use the summary data and the box plot to calculate the range, interquartile range, mean and standard deviation of the times, and state, giving a reason, whether you would recommend using the mean and standard deviation or the median and interquartile range to describe these data.
Representations of Data Questions
160 exam-style questions on Edexcel A Level Maths Representations of Data, covering 3.1 Outliers, 3.2 Box Plots, 3.3 Cumulative Frequency, 3.4 Histograms, and 3.5 Comparing Data. Each one has a worked solution and a mark scheme showing where the marks go.