Question 99
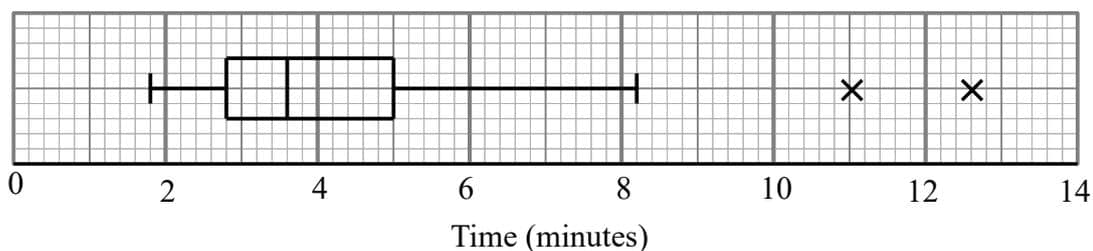
100 students completed a puzzle, their times are summarised by summary data and the box plot.
a.[1]
Write down the range of the times.
b.[1]
Write down the interquartile range of the times.
c.[3]
Calculate ∑x \sum x\,∑x and ∑x2 \sum x^2\,∑x2 for the times.
d.[2]
State, giving a reason, whether you would recommend using the mean and standard deviation or the median and interquartile range to describe these data.
Representations of Data Questions
160 exam-style questions on Edexcel A Level Maths Representations of Data, covering 3.1 Outliers, 3.2 Box Plots, 3.3 Cumulative Frequency, 3.4 Histograms, and 3.5 Comparing Data. Each one has a worked solution and a mark scheme showing where the marks go.