Skip to content

Course home

Conditional Probability

Conditional Probability

EasyMediumHard
123456789101112131415161718192021222324252627282930313233343536373839404142434445464748495051525354555657585960616263646566676869707172737475767778798081828384858687888990919293949596979899100101102103104105106107108109110111112113114115116117118119120121122123124125126127128129130131132133134135136137138139140141142143144145146147148149150151152153154155156157158159160161162163164165166167168169170171172173174175176177178179180181182183184185186187188189190191192193194195196197198199200201202203204205206207208209210211212213214215216217218219220221222223224225226227228229230231232233234235236237238239240241242243244245246247248249250251252253254255256257258259260261262263264265266267268269270271272273274275276277278279280281282283284285286287288289290291292293294295296297298299300301302303304305306307308309310311312313314315316317318319320321322323324325326327328329330
Question 32

The Venn diagram shows the probabilities associated with three events XXX, Y Y\,Y and ZZZ, representing students choosing to study different languages. The probability of students studying only X X\,X is 0.15, only Y Y\,Y is 0.2, and only Z Z\,Z is 0.4. The intersection X∩Y X \cap Y\,X∩Y is q q\,q and Y∩Z Y \cap Z\,Y∩Z is ppp. Events X X\,X and Z Z\,Z are disjoint. The probability of studying none of these languages is rrr.
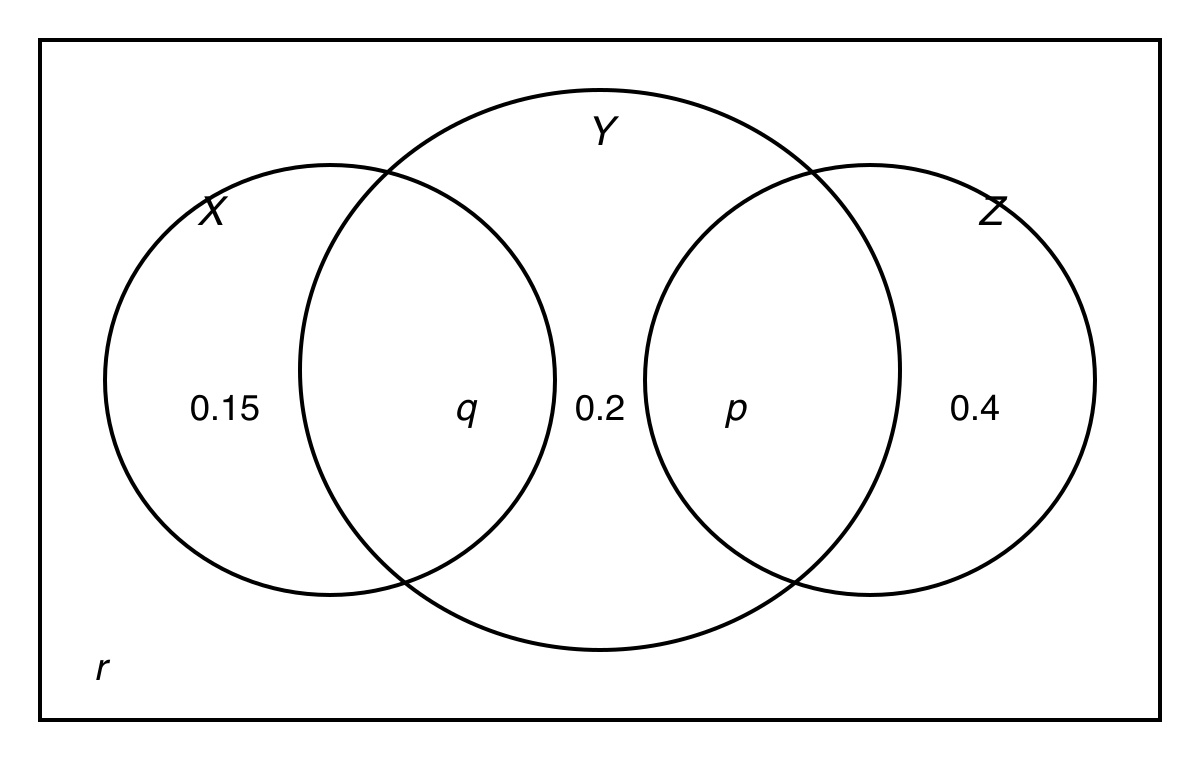
Venn diagram with events X and Z disjoint, each overlapping Y, showing probabilities 0.15, 0.2, 0.4, p, q and r in their respective regions.

a.

Write down the two events that are mutually exclusive.

[1]
b.

Given that P(Y∣Z)=0.2P(Y | Z) = 0.2P(Y∣Z)=0.2, find the value of ppp.

[2]
c.

Given also that X X\,X and Y Y\,Y are independent, find the values of q q\,q and rrr.

[4]
Markscheme

Conditional Probability Questions

  1. A Level
  2. /Maths
  3. /Conditional Probability

368 exam-style questions on Edexcel A Level Maths Conditional Probability, covering 2.1 Set Notation, 2.2 Conditional Probability, 2.3 Conditional Probabilities in Venn Diagrams, 2.4 Probability Formulae, and 2.5 Tree Diagrams. Each one has a worked solution and a mark scheme showing where the marks go.

Question bank