Question 62
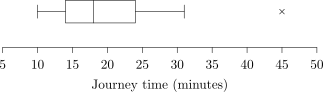
The supplied box plot shows journey times. An outlier is defined as a value more than 1.5×IQR1.5\times\mathrm{IQR}1.5×IQR beyond the nearer quartile.
a.[2]
Calculate the upper outlier boundary.
b.[1]
Verify that the separately plotted value is an outlier.
c.[1]
Explain why it should not automatically be deleted.
2.5 Data presentation and interpretation Questions
278 exam-style questions on CCEA A Level Maths 2.5 Data presentation and interpretation, covering 2.5.1 Data presentation and interpretation, 2.5.2 Data presentation and interpretation, 2.5.3 Data presentation and interpretation, 2.5.4 Data presentation and interpretation, 2.5.5 Data presentation and interpretation, 2.5.6 Data presentation and interpretation, 2.5.7 Data presentation and interpretation, 2.5.8 Data presentation and interpretation, 2.5.9 Data presentation and interpretation, and 2.5 Data presentation and interpretation. Each one has a worked solution and a mark scheme showing where the marks go.