Question 31
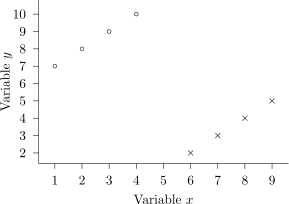
The scatter diagram contains two distinct groups.
a.[1]
Describe the association when all eight points are considered together.
b.[1]
Describe the association within each group.
c.[2]
Explain why a single overall value of r r\,r could be misleading.
2.5 Data presentation and interpretation Questions
278 exam-style questions on CCEA A Level Maths 2.5 Data presentation and interpretation, covering 2.5.1 Data presentation and interpretation, 2.5.2 Data presentation and interpretation, 2.5.3 Data presentation and interpretation, 2.5.4 Data presentation and interpretation, 2.5.5 Data presentation and interpretation, 2.5.6 Data presentation and interpretation, 2.5.7 Data presentation and interpretation, 2.5.8 Data presentation and interpretation, 2.5.9 Data presentation and interpretation, and 2.5 Data presentation and interpretation. Each one has a worked solution and a mark scheme showing where the marks go.