Question 37
The histogram shows the times taken by a group of people to complete a puzzle. The total frequency represented by the bars beyond 150 seconds is 120.
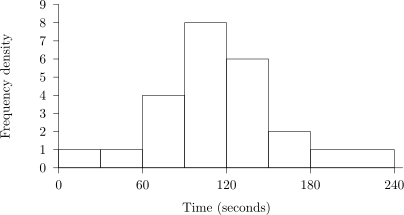
Estimate the percentage of people who took less than 90 seconds.
2.5 Data presentation and interpretation Questions
278 exam-style questions on CCEA A Level Maths 2.5 Data presentation and interpretation, covering 2.5.1 Data presentation and interpretation, 2.5.2 Data presentation and interpretation, 2.5.3 Data presentation and interpretation, 2.5.4 Data presentation and interpretation, 2.5.5 Data presentation and interpretation, 2.5.6 Data presentation and interpretation, 2.5.7 Data presentation and interpretation, 2.5.8 Data presentation and interpretation, 2.5.9 Data presentation and interpretation, and 2.5 Data presentation and interpretation. Each one has a worked solution and a mark scheme showing where the marks go.