Question 64
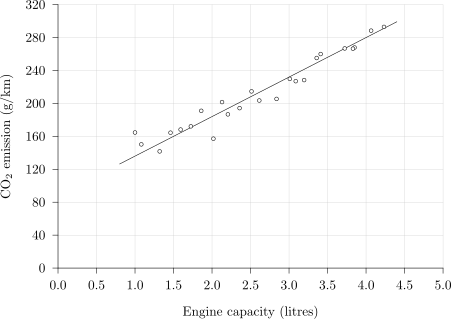
The scatter diagram below shows the engine capacity, in litres, and the CO2 _2\,2 emission, in g/km, of 24 cars. The regression line of CO2 _2\,2 emission y y\,y g/km on engine capacity x x\,x litres is drawn on the diagram, and its equation is
y=88+48xy = 88 + 48xy=88+48x
a.[1]
Describe the correlation between engine capacity and CO2 _2\,2 emission.
b.[1]
Give an interpretation of the gradient of the regression line.
c.[2]
Use the regression line to estimate the CO2 _2\,2 emission of a car with an engine capacity of 2.5 litres.
d.[1]
A car has an engine capacity of 6.0 litres. Explain why the regression line should not be used to estimate its CO2 _2\,2 emission.
2.2.2 Scatter diagrams and correlation Questions
157 exam-style questions on AQA A Level Maths 2.2.2 Scatter diagrams and correlation. Each one has a worked solution and a mark scheme showing where the marks go.