The diagram below shows three supply curves (labelled SaS_aSa, SbS_bSb, ScS_cSc) and three demand curves (labelled D1D_1D1, D2D_2D2, D3D_3D3) for the Australian dollar (A$). The price of the Australian dollar is quoted in US dollars ($). The original equilibrium is at point X.
There is now a recession in Australia. At the same time, the USA is experiencing a consumer boom. Which point A, B, C or D will represent the new equilibrium in the market for the Australian dollar?
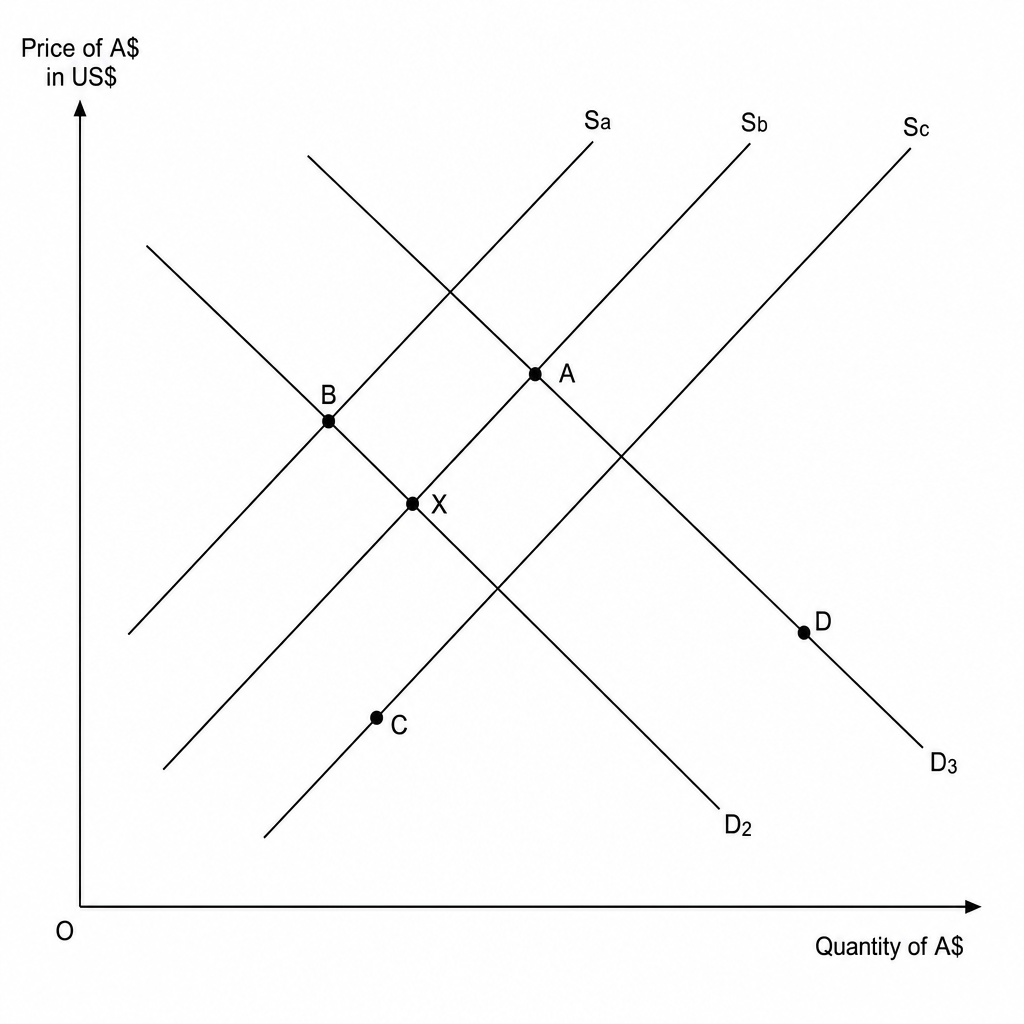
Point A
Point B
Point C
Point D

