Skip to content
MathsGenie logo
Open app

Course home

  1. A Level
  2. Economics OCR
  3. Question bank

Exchange rates

EasyMediumHard
123456789101112131415
Question 13

The diagram below shows a change in the exchange rate of a country's currency.
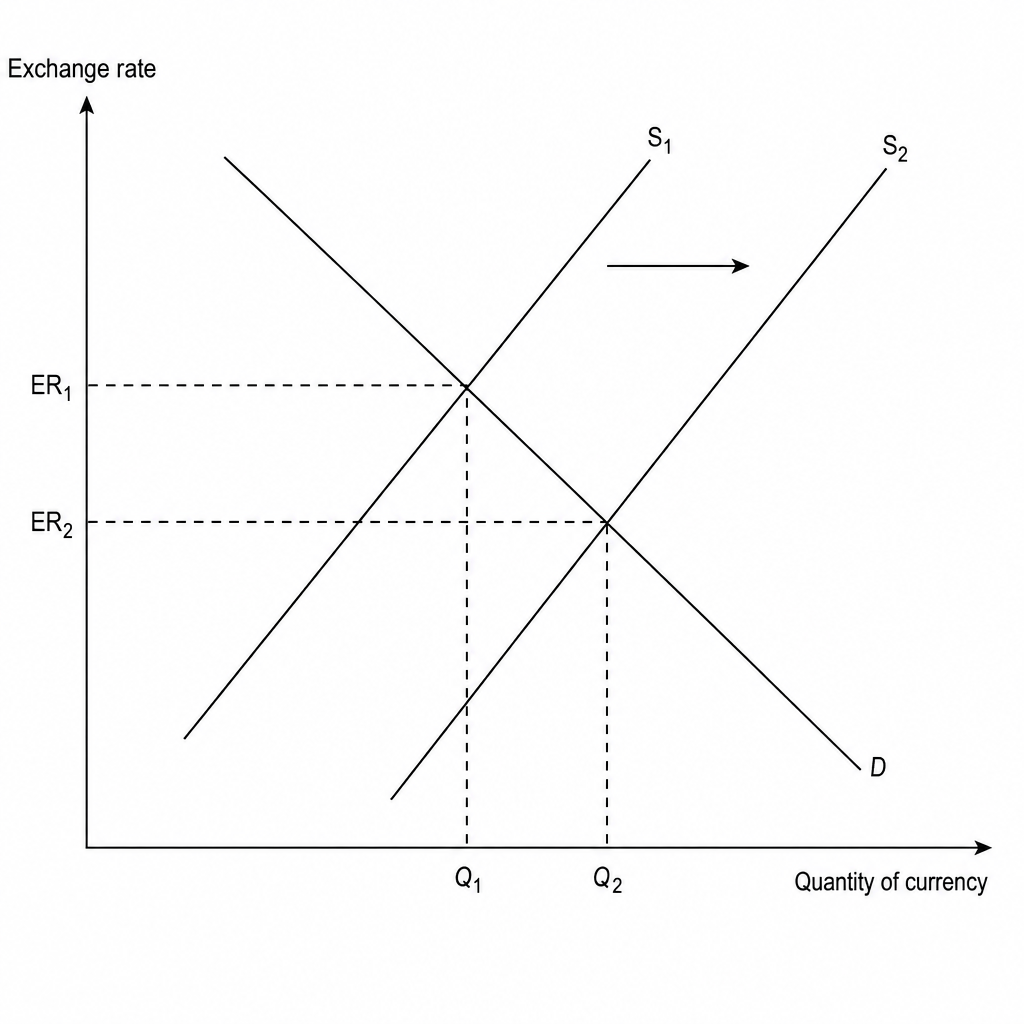
A foreign exchange market diagram showing an increase in the supply of currency, shifting the supply curve rightward from S1 to S2, which causes a decrease in the exchange rate from ER1 to ER2.

What is most likely to have caused the change illustrated in the diagram?

An increase in the domestic marginal propensity to import

A rise in domestic interest rates relative to major trading partners

An increase in foreign direct investment (FDI) inflows into the economy

A decrease in the domestic rate of inflation relative to major trading partners

Exchange rates Questions

  1. A Level
  2. /Economics
  3. /Exchange rates
