What you'll learn
- How elasticity measures responsiveness using percentage changes.
- How to calculate and interpret PED, YED, XED and PES.
- How diagrams show different elasticity values and the link between PED and total revenue.
- How to evaluate when elasticity is useful — and when it can mislead.
1. The big idea: responsiveness
Economists often want to know not just whether quantity changes, but how much it changes. Elasticity gives you a numerical measure of that responsiveness.
Elasticity
Elasticity measures how responsive one economic variable is to a change in another variable, using percentage changes rather than absolute changes.
A percentage change is calculated from the original value:
%ΔX=new value−old valueold value×100\%\Delta X = \frac{\text{new value} - \text{old value}}{\text{old value}} \times 100%ΔX=old valuenew value−old value×100Elasticity calculations normally assume ceteris paribus, meaning “all other things equal”. For example, when calculating the effect of price on quantity demanded, we assume income, tastes, advertising and competitors’ prices are unchanged.
Why percentages?
A £1 price rise is huge for a £2 bus fare but tiny for a £30,000 car. Percentage changes make responsiveness comparable across different markets.
2. Different elasticity values
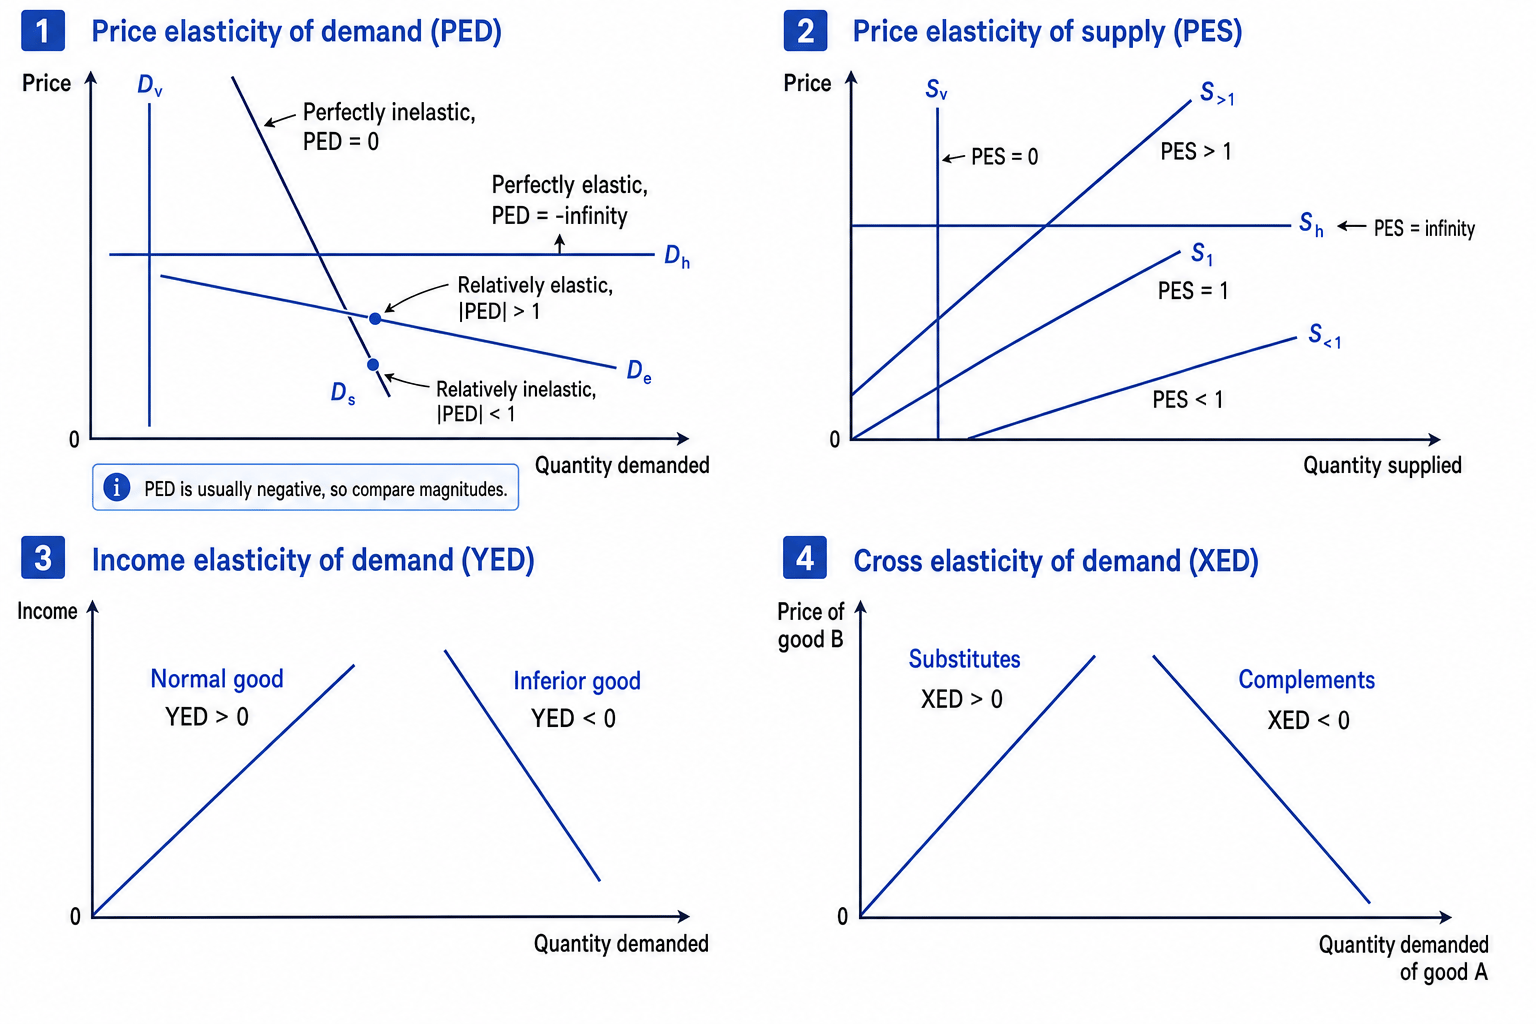
The word elastic means a relatively strong quantity response. Inelastic means a relatively weak quantity response.
For PED, the sign is usually negative because demand normally falls when price rises, so economists often compare the magnitude: for example, a PED of -2 is more elastic than a PED of -0.4.
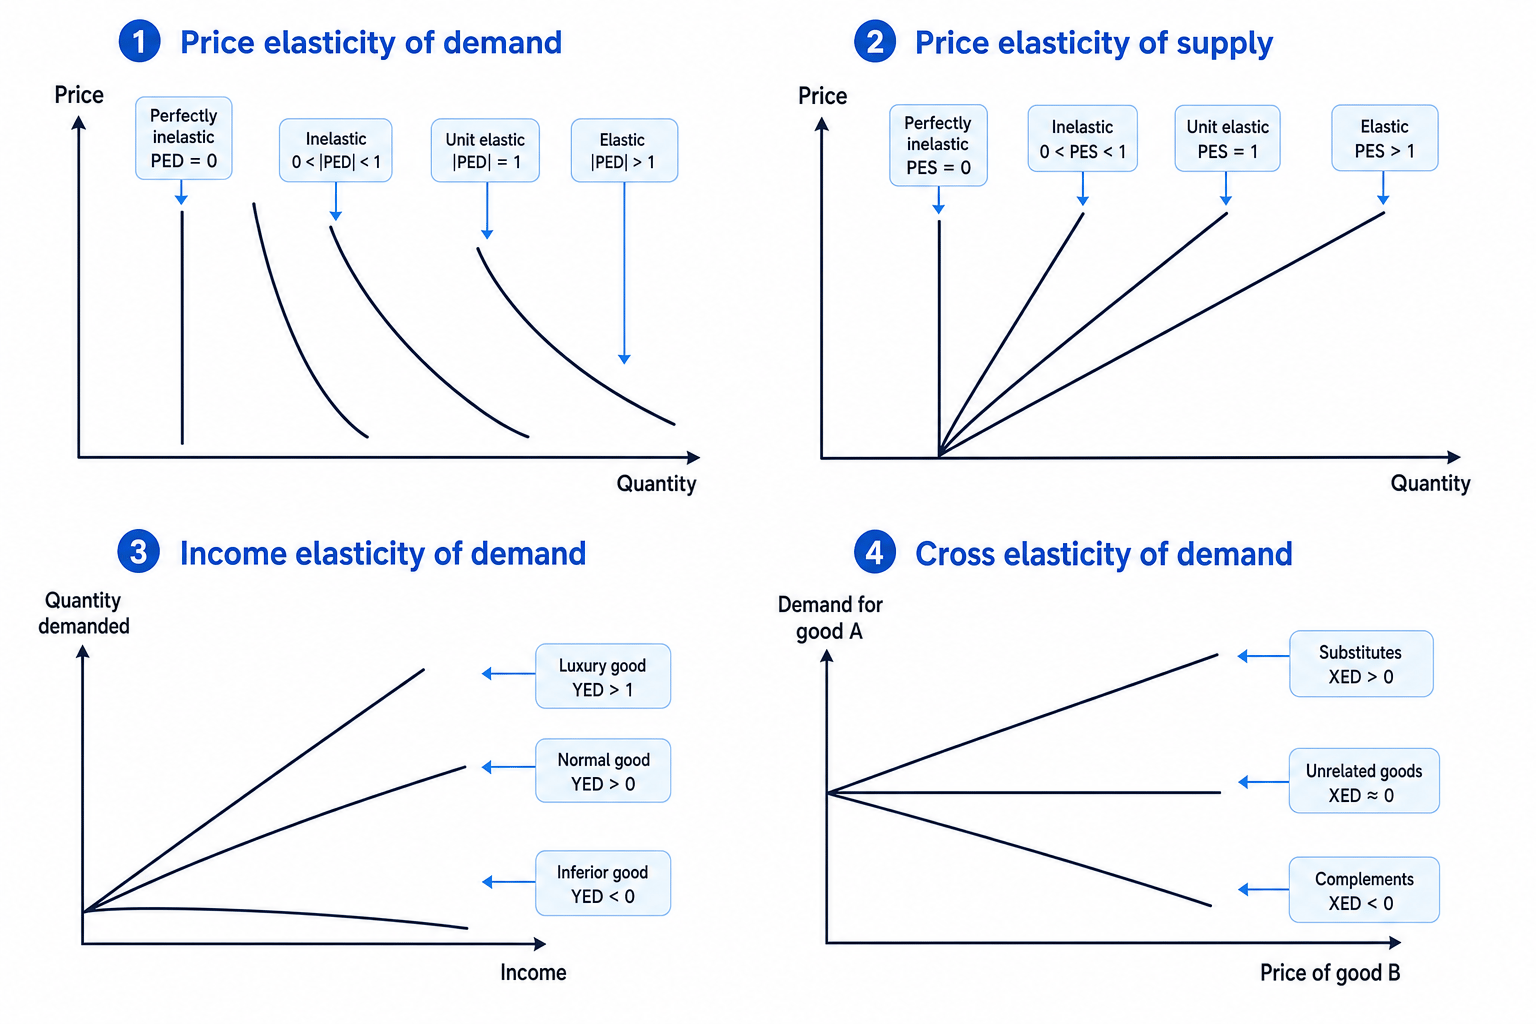
The diagram below summarises common values for PED, YED, XED and PES. Notice that the YED and XED panels are not ordinary demand curves: they show how quantity demanded relates to income or another good’s price.
Elasticity is not slope
A steep curve often suggests inelastic demand or supply, but elasticity is not the same as slope. Slope uses units; elasticity uses percentage changes and is unit-free.
3. Price elasticity of demand (PED)
Price elasticity of demand (PED)
PED measures the responsiveness of quantity demanded to a change in the good’s own price.
PED=%ΔQd%ΔP\text{PED} = \frac{\%\Delta Q_d}{\%\Delta P}PED=%ΔP%ΔQdTypical interpretation:
- If ∣PED∣>1\left|\text{PED}\right| > 1∣PED∣>1, demand is price elastic.
- If ∣PED∣=1\left|\text{PED}\right| = 1∣PED∣=1, demand is unit elastic.
- If ∣PED∣<1\left|\text{PED}\right| < 1∣PED∣<1, demand is price inelastic.
- If PED=0\text{PED} = 0PED=0, demand is perfectly inelastic.
Calculating PED
- Price rises from £2.00 to £2.20, so the percentage change in price is 2.20−2.002.00×100=10%\frac{2.20 - 2.00}{2.00} \times 100 = 10\%2.002.20−2.00×100=10%.
- Quantity demanded falls from 1,000 to 850 units, so the percentage change in quantity demanded is 850−1,0001,000×100=−15%\frac{850 - 1{,}000}{1{,}000} \times 100 = -15\%1,000850−1,000×100=−15%.
- Substitute into the formula: PED=−15%10%=−1.5\text{PED} = \frac{-15\%}{10\%} = -1.5PED=10%−15%=−1.5.
- Since ∣PED∣=1.5>1\left|\text{PED}\right| = 1.5 > 1∣PED∣=1.5>1, demand is price elastic.
What determines PED?
PED is usually more elastic when there are many close substitutes, the good takes a large share of income, it is non-essential, consumers have time to adjust, or brand loyalty is weak.
PED is usually more inelastic for necessities, addictive goods, goods with few substitutes, very cheap items, or in the short run. For example, demand for petrol is often inelastic in the short run because many commuters cannot immediately stop driving.
4. PED and a firm’s total revenue
Total revenue
Total revenue (TR) is the money a firm receives from sales.
TR=P×QTR = P \times QTR=P×QPED matters because a price change has two effects: price per unit changes, and quantity sold changes. The overall impact on total revenue depends on which effect is stronger.
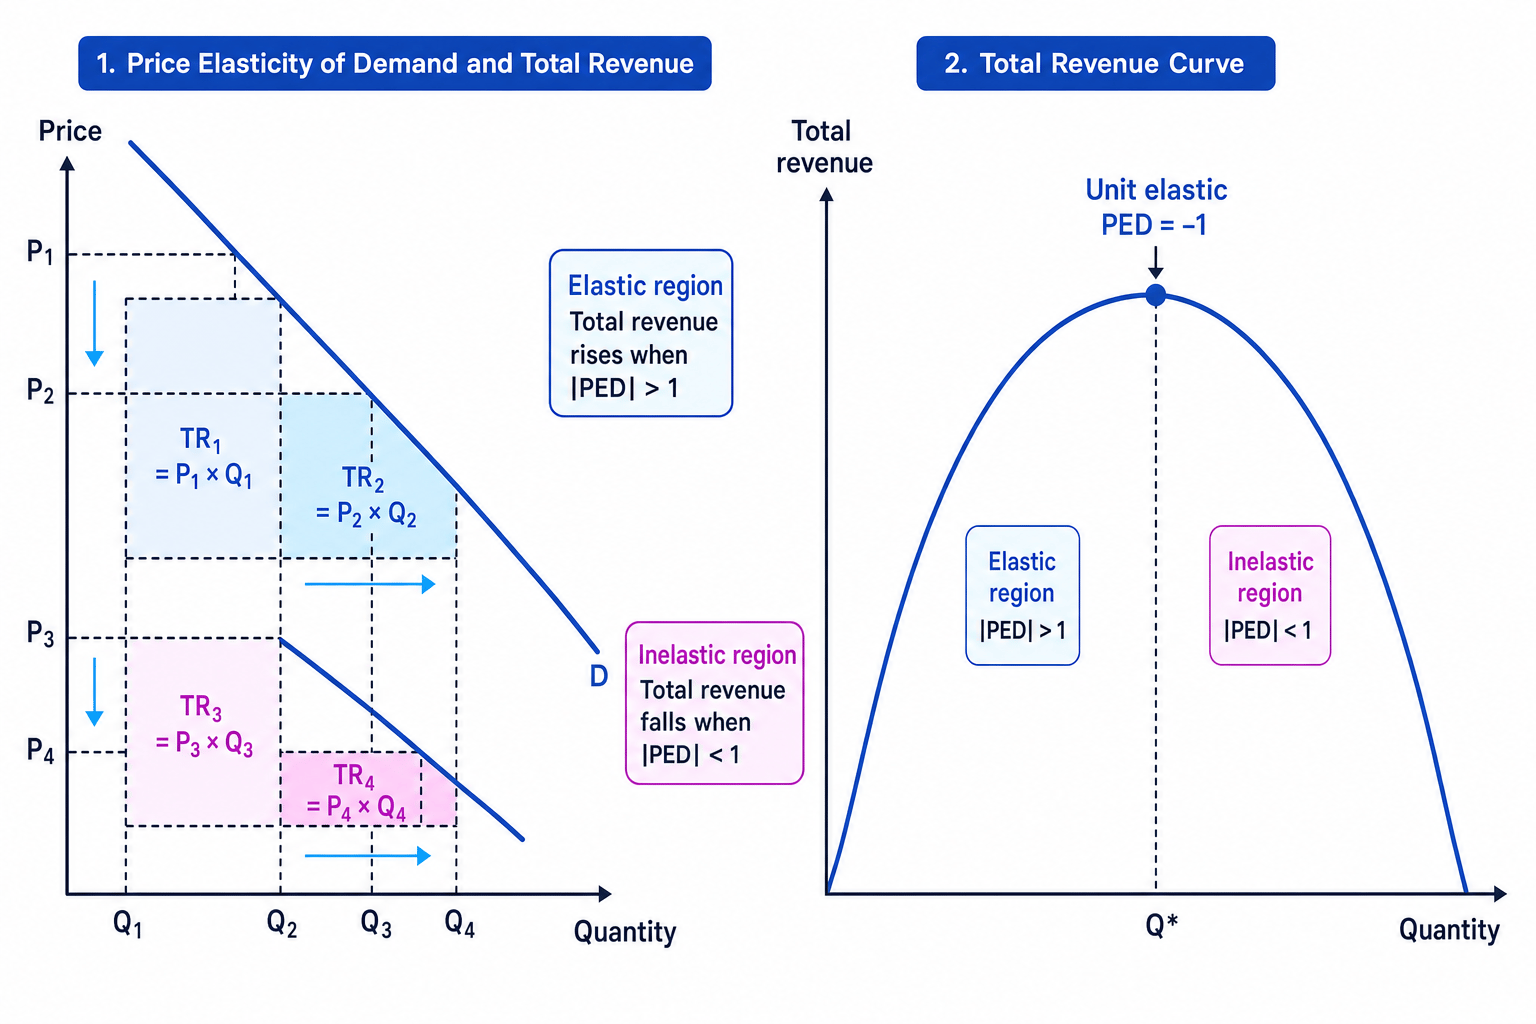
The diagram below shows the key relationship: elastic demand means a price cut raises total revenue; inelastic demand means a price cut lowers total revenue.
PED and total revenue
If demand is price elastic, price and total revenue move in opposite directions. If demand is price inelastic, price and total revenue move in the same direction.
Linking PED to total revenue
- A firm cuts price from £10 to £8, so the percentage change in price is 8−1010×100=−20%\frac{8 - 10}{10} \times 100 = -20\%108−10×100=−20%.
- Quantity demanded rises from 100 to 130 units, so the percentage change in quantity is 130−100100×100=30%\frac{130 - 100}{100} \times 100 = 30\%100130−100×100=30%.
- Calculate PED: PED=30%−20%=−1.5\text{PED} = \frac{30\%}{-20\%} = -1.5PED=−20%30%=−1.5, so demand is elastic.
- Compare revenue: old revenue is £10 times 100 = £1,000; new revenue is £8 times 130 = £1,040. The price cut raises total revenue.
Revenue is not profit
Higher total revenue does not guarantee higher profit. If extra output is costly to produce, profit may fall even when revenue rises.
5. Income elasticity of demand (YED)
Income elasticity of demand (YED)
YED measures the responsiveness of quantity demanded to a change in consumers’ income.
YED=%ΔQd%ΔY\text{YED} = \frac{\%\Delta Q_d}{\%\Delta Y}YED=%ΔY%ΔQdInterpretation:
- If YED is positive, the good is a normal good.
- If 0<YED<10 < \text{YED} < 10<YED<1, it is often a necessity.
- If YED>1\text{YED} > 1YED>1, it is often a luxury.
- If YED is negative, the good is an inferior good.
Calculating YED
- Average income rises from £30,000 to £33,000, so income rises by 33,000−30,00030,000×100=10%\frac{33{,}000 - 30{,}000}{30{,}000} \times 100 = 10\%30,00033,000−30,000×100=10%.
- Demand for a budget food product falls from 12,000 to 11,040 units, so quantity demanded changes by 11,040−12,00012,000×100=−8%\frac{11{,}040 - 12{,}000}{12{,}000} \times 100 = -8\%12,00011,040−12,000×100=−8%.
- Calculate YED: YED=−8%10%=−0.8\text{YED} = \frac{-8\%}{10\%} = -0.8YED=10%−8%=−0.8.
- The good is inferior because demand falls as income rises.
YED depends on whether the good is a necessity or luxury, consumers’ income level, tastes, confidence and income distribution. During a cost-of-living squeeze, demand for cheaper own-label groceries may rise even when real incomes fall.
6. Cross elasticity of demand (XED)
Cross elasticity of demand (XED)
XED measures the responsiveness of demand for good A to a change in the price of good B.
XEDA,B=%ΔQd,A%ΔPB\text{XED}_{A,B} = \frac{\%\Delta Q_{d,A}}{\%\Delta P_B}XEDA,B=%ΔPB%ΔQd,AInterpretation:
- If XED is positive, the goods are substitutes.
- If XED is negative, the goods are complements.
- If XED is close to zero, the goods are largely unrelated.
- The larger the magnitude, the stronger the relationship.
Calculating XED
- The price of coffee brand B rises from £3.00 to £3.30, so the percentage price change is 3.30−3.003.00×100=10%\frac{3.30 - 3.00}{3.00} \times 100 = 10\%3.003.30−3.00×100=10%.
- Demand for coffee brand A rises from 1,000 to 1,060 cups, so quantity demanded changes by 1,060−1,0001,000×100=6%\frac{1{,}060 - 1{,}000}{1{,}000} \times 100 = 6\%1,0001,060−1,000×100=6%.
- Calculate XED: XEDA,B=6%10%=0.6\text{XED}_{A,B} = \frac{6\%}{10\%} = 0.6XEDA,B=10%6%=0.6.
- The goods are substitutes, but not perfect substitutes, because XED is positive but below 1.
XED depends on closeness of substitutes, switching costs, brand loyalty, whether goods are jointly consumed, and how narrowly the market is defined.
7. Price elasticity of supply (PES)
Price elasticity of supply (PES)
PES measures the responsiveness of quantity supplied to a change in the good’s price.
PES=%ΔQs%ΔP\text{PES} = \frac{\%\Delta Q_s}{\%\Delta P}PES=%ΔP%ΔQsPES is usually positive because higher prices give firms an incentive to supply more.
- PES greater than 1 means supply is price elastic.
- PES equal to 1 means supply is unit elastic.
- PES between 0 and 1 means supply is price inelastic.
- PES equal to 0 means perfectly inelastic supply.
Calculating PES
- The price of strawberries rises from £2.00 to £2.40, so price rises by 2.40−2.002.00×100=20%\frac{2.40 - 2.00}{2.00} \times 100 = 20\%2.002.40−2.00×100=20%.
- Growers increase weekly supply from 10,000 to 11,000 punnets, so quantity supplied rises by 11,000−10,00010,000×100=10%\frac{11{,}000 - 10{,}000}{10{,}000} \times 100 = 10\%10,00011,000−10,000×100=10%.
- Calculate PES: PES=10%20%=0.5\text{PES} = \frac{10\%}{20\%} = 0.5PES=20%10%=0.5.
- Supply is price inelastic because quantity supplied rises proportionately less than price.
PES is higher when firms have spare capacity, available stocks, mobile labour and capital, short production times, and goods are easy to store. PES is lower when production takes time, factors are specialised, stocks are perishable, or regulation delays output — for example, UK housing supply is often inelastic because of planning constraints.
8. Evaluating usefulness and significance
Elasticity is powerful because it helps firms and governments predict behaviour. Firms use PED when setting prices, YED when forecasting demand across the economic cycle, XED when monitoring competitors, and PES when planning capacity. Governments use elasticity to estimate the effects of indirect taxes, subsidies, minimum prices and supply-side policies.
However, elasticity estimates have limits. They are usually based on past data, and real markets rarely satisfy ceteris paribus. Values can vary over time, between consumer groups, and along the same demand curve. A PED estimate from normal conditions may be less reliable during shocks such as Brexit trade frictions, global supply-chain disruption or a sharp rise in energy prices.
A strong judgement is that elasticity is most useful when changes are small, markets are stable and the time period is clear. It should guide decisions, not replace wider analysis of costs, profit, welfare, equity and government failure.
Base matters
Unless the question specifies midpoint or arc elasticity, use the original value as the base for percentage changes. For large changes, different bases can give different elasticity estimates.
In the exam
- Write the correct formula first, then substitute percentage changes with the correct sign.
- Interpret the value in context: elastic or inelastic, normal or inferior, substitutes or complements.
- If discussing usefulness, evaluate the time period, data reliability, market conditions and whether revenue, profit or welfare is the real objective.
Check yourself
- A 10% price rise causes quantity demanded to fall by 4%. What is PED, and what happens to total revenue?
- Why might demand for holidays have a high positive YED?
- What factors make PES for new UK housing low in the short run?