The interaction of markets
What you'll learn
- How demand and supply interact to determine market price and quantity.
- What ceteris paribus means and why economists use it.
- How to explain equilibrium, surpluses and shortages using a diagram.
- How a change in one market can affect related markets, and how to evaluate the size of that effect.
Starting point: what is a market?
A market is any arrangement where buyers and sellers interact to exchange a good or service. It does not have to be a physical place: the market for train tickets, coffee, housing rentals, or online streaming subscriptions all count.
Demand is the quantity consumers are willing and able to buy at different prices over a period of time. Supply is the quantity producers are willing and able to sell at different prices over a period of time.
In most markets:
- the demand curve slopes downwards because, as price falls, consumers are usually willing and able to buy more;
- the supply curve slopes upwards because, as price rises, producers have a stronger incentive to supply more.
Ceteris paribus
Ceteris paribus
Ceteris paribus means “all other things being equal”. Economists use it to isolate the effect of one variable, such as price, while assuming other influences stay unchanged.
This matters because real markets are messy. For example, petrol sales might change because of petrol prices, incomes, weather, commuting patterns, electric vehicle ownership, or public transport fares. Ceteris paribus lets you focus on one cause at a time.
Using ceteris paribus
-
Suppose the price of petrol rises from £1.45 to £1.60 per litre, while incomes, car ownership, bus fares and commuting patterns are held constant.
-
The higher petrol price increases the cost of driving, so consumers have an incentive to economise by driving less, car-sharing, or switching some journeys to public transport.
-
The result is a movement up along the petrol demand curve: the price has risen, so quantity demanded falls, ceteris paribus.
Ceteris paribus is not a prediction that nothing else changes
In the real world, other factors often change at the same time. Ceteris paribus is an analytical assumption used to isolate one relationship, not a claim that markets are perfectly controlled experiments.
The interaction of demand and supply
Neither demand nor supply alone determines the market outcome. The market price and quantity are determined by the point where buyers’ plans and sellers’ plans are compatible.
Market equilibrium
Market equilibrium is the price and quantity where quantity demanded equals quantity supplied, so there is no tendency for the market price to change.
At equilibrium:
Qd=QsQ_d = Q_sQd=Qswhere QdQ_dQd means quantity demanded and QsQ_sQs means quantity supplied.
The diagram below shows demand and supply meeting at equilibrium. It also shows what happens if the price is set above or below equilibrium.
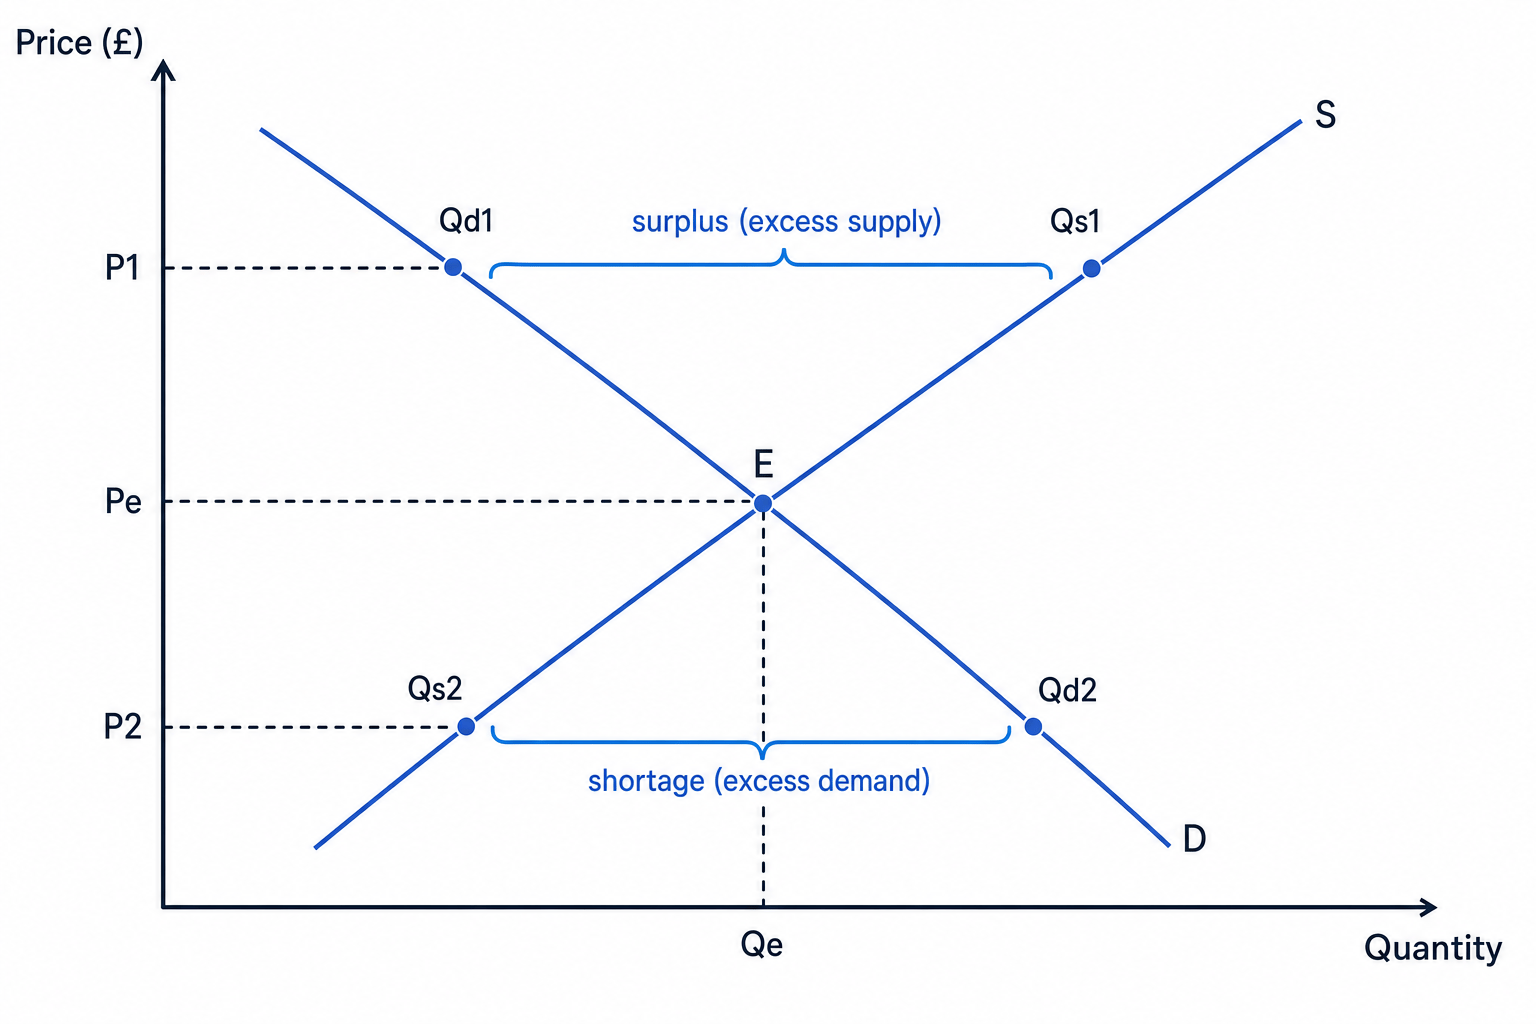
At price Pe, the market clears: consumers want to buy exactly the quantity firms want to sell, Qe.
At price P1, price is above equilibrium. Quantity supplied is greater than quantity demanded, creating a surplus, also called excess supply. Firms may have unsold stock, so they have an incentive to cut prices.
At price P2, price is below equilibrium. Quantity demanded is greater than quantity supplied, creating a shortage, also called excess demand. Some consumers cannot buy the good at that price, so there is upward pressure on price if the market is allowed to adjust.
The price mechanism
Prices act as signals and incentives. A surplus signals that price is too high; a shortage signals that price is too low. In a free market, price changes help move the market back towards equilibrium.
Market disequilibrium
Disequilibrium occurs when quantity demanded does not equal quantity supplied at the current price.
There are two main cases:
- Excess supply: firms want to sell more than consumers want to buy.
- Excess demand: consumers want to buy more than firms want to sell.
Finding the shortage in a ticket market
-
Suppose a concert venue sets the ticket price at £40, below the market-clearing price. At £40, fans demand 50,000 tickets, but the venue supplies only 20,000 tickets.
-
Compare quantity demanded with quantity supplied. Because 50,000 tickets demanded is greater than 20,000 tickets supplied, the market has excess demand.
-
The shortage is 30,000 tickets. In a free market, this would create upward pressure on ticket prices, or lead to non-price rationing such as queues, waiting lists or ballots.
Do not describe a shortage as low demand
A shortage means demand is greater than supply at the current price. It does not mean demand is weak; in fact, it often occurs because demand is strong relative to available supply.
Shifts versus movements along curves
A movement along a demand or supply curve happens when the good’s own price changes.
A shift of a curve happens when a non-price factor changes. For demand, this could be income, tastes, advertising, population, or the price of related goods. For supply, it could be costs of production, technology, indirect taxes, subsidies, weather, regulation, or productivity.
The quick test
If the good’s own price changes, think “movement along”. If anything else changes, think “shift of the curve”.
For example, if the price of coffee rises, there is a movement along the demand curve for coffee. But if consumer incomes rise and coffee is a normal good, the whole demand curve for coffee may shift right.
Related markets
Markets do not exist in isolation. A change in one market can affect another market if the goods are related.
Related markets
Related markets are markets linked through consumer behaviour, production processes, or factor demand. The main links are substitutes, complements and derived demand.
A substitute is a good that can be used instead of another good, such as tea and coffee. If coffee becomes more expensive, demand for tea may rise.
A complement is a good used together with another good, such as games consoles and video games. If more consoles are bought, demand for games may increase.
Derived demand means demand for a good or factor arises from demand for another product. For example, demand for lithium batteries is partly derived from demand for electric cars.
The diagram below shows how an increase in demand in one market can transmit into a related market.
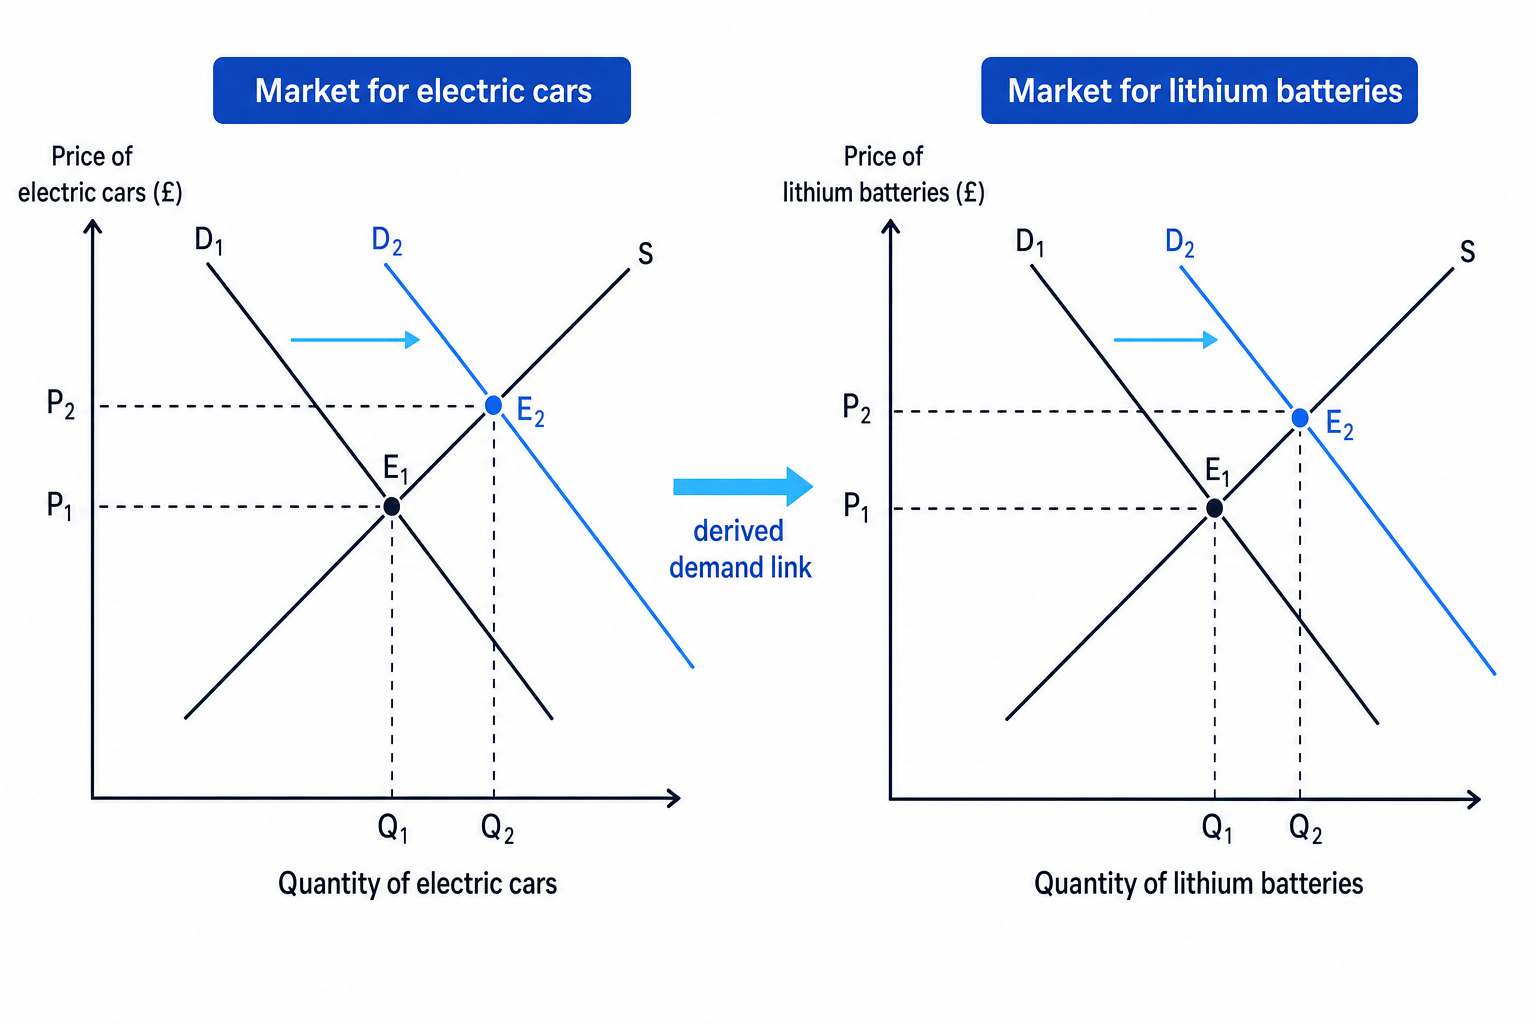
In the electric car market, demand shifts right from D1 to D2, increasing both price and quantity. Because electric cars use lithium batteries, firms need more batteries, so demand in the lithium battery market also shifts right.
Tracing a shock across related markets
-
Suppose stronger environmental preferences and government support increase demand for electric cars. In the electric car market, the demand curve shifts right, causing a higher equilibrium price and quantity.
-
Higher electric car output increases manufacturers’ need for lithium batteries. Because battery demand is derived from electric car production, demand for lithium batteries shifts right.
-
The lithium battery market moves to a new equilibrium with a higher price and quantity. This raises costs for electric car producers, which could later reduce supply of electric cars or slow further price falls.
-
The final impact depends on supply responsiveness. If lithium mining and refining capacity is fixed in the short run, battery prices may rise sharply. In the long run, investment, recycling and alternative battery technologies may make supply more elastic, reducing the pressure on price.
Evaluating the impact on related markets
For evaluation, avoid writing as if the effect is automatic and equally large in every case. The impact depends on several factors.
1. How closely related are the goods?
The closer the relationship, the stronger the spillover effect. A rise in the price of butter may noticeably increase demand for margarine because they are close substitutes. But a rise in the price of butter is unlikely to have much effect on demand for rice.
Economists often use cross-price elasticity of demand to measure this link. Cross-price elasticity of demand shows how responsive demand for one good is to a change in the price of another good. A positive value suggests substitutes; a negative value suggests complements.
2. How elastic are demand and supply?
If supply in the related market is price inelastic, a demand increase causes a larger rise in price and a smaller rise in quantity. This is common where production capacity is limited, such as housing, energy, or key minerals.
If supply is more price elastic, firms can increase output more easily, so the quantity effect may be larger and the price effect smaller.
3. Short run versus long run
In the short run, markets may struggle to adjust. For example, after global supply-chain shocks, shortages of semiconductors limited car production because chip supply could not quickly expand.
In the long run, firms can invest, train workers, develop new suppliers, or redesign products. This means the same initial shock may have a smaller effect over time.
4. The size and duration of the original shock
A temporary change in demand may have little effect on related markets if firms expect it to fade. A permanent shift, such as the green transition increasing demand for renewable energy infrastructure, is more likely to trigger investment and wider market adjustments.
5. Government intervention and market power
Government policy can strengthen or weaken market links. Subsidies for electric vehicles, taxes on petrol and regulation of emissions all affect related markets. Firms with market power may also absorb cost changes in profit margins rather than passing them fully to consumers.
A strong evaluation judgement
The biggest related-market effects occur when goods are closely linked, the original shock is large and lasting, and supply in the affected market is inelastic in the short run.
Bringing it together
The full chain of analysis is:
- Identify the original market and the initial change.
- Decide whether demand or supply shifts, and show the new equilibrium.
- Identify the related market link: substitute, complement, input, or derived demand.
- Show the likely shift in the related market.
- Evaluate how large, fast and long-lasting the effect is likely to be.
This is a useful synoptic skill. For example, an increase in global energy prices affects household bills, business costs, transport markets, food prices and inflation. One market shock can spread across the economy.
In the exam
-
Draw diagrams with labelled axes, curves, equilibrium points, and clear shifts from D1 to D2 or S1 to S2.
-
Use ceteris paribus when explaining the first-round effect, then evaluate by relaxing the assumption and considering real-world complications.
-
For related markets, always state the link: substitute, complement, input, or derived demand. Then judge the likely size of the effect using elasticity, time period and market context.
Check yourself
-
Why does a price above equilibrium create a surplus rather than a shortage?
-
How is a shift in demand different from a movement along a demand curve?
-
Give one example of a change in one market affecting a related market, and explain whether the link is through substitutes, complements or derived demand.
