The concept of the margin
What you'll learn
- What economists mean by the margin and why decisions are often made “one step at a time”.
- How to calculate marginal values from totals.
- The difference between total utility and marginal utility.
- How diminishing marginal utility helps explain the downward-sloping demand curve.
Starting point: scarcity, choice and “one more”
Economics begins with scarcity: resources are limited, but human wants are unlimited. Because of scarcity, people, firms and governments must make choices.
A lot of economic choice is not “all or nothing”. Instead, it is about whether to do a little bit more or a little bit less.
That is where the margin comes in.
Margin
The margin means the next unit, extra unit, or final unit being considered. A marginal decision asks: “What happens if I do one more?”
For example:
- Should you buy one more coffee?
- Should a firm hire one more worker?
- Should the government spend an extra £1 billion on the NHS?
- Should a consumer buy one more unit of a good at the current price?
The key idea is that rational decision-makers compare the extra benefit with the extra cost.
Marginal benefit and marginal cost
Marginal benefit is the extra benefit gained from consuming or producing one more unit. Marginal cost is the extra cost of consuming or producing one more unit.
The marginal decision rule
A choice is worthwhile if the marginal benefit is greater than the marginal cost. If the marginal cost is greater than the marginal benefit, the extra unit is not worthwhile.
Choosing at the margin
Suppose you are deciding whether to buy one more takeaway lunch.
- Identify the marginal benefit: you value the extra lunch at £7 because it saves time and gives you satisfaction.
- Identify the marginal cost: the lunch price is £5, and spending that money means giving up something else.
- Compare them: the marginal benefit of £7 is greater than the marginal cost of £5, so buying the extra lunch is worthwhile.
- Check the next unit separately: a second extra lunch may give much less benefit, so the same decision may not hold again.
Marginal values: the core calculation
A marginal value measures how much a total changes when quantity changes.
This is used across economics:
- Marginal cost: extra cost from producing more output.
- Marginal revenue: extra revenue from selling more output.
- Marginal utility: extra satisfaction from consuming more.
- Marginal product: extra output from employing more input, such as labour.
Marginal value
A marginal value is calculated as the change in a total value divided by the change in quantity.
Marginal value=ΔTVΔQ\text{Marginal value} = \frac{\Delta TV}{\Delta Q}Marginal value=ΔQΔTVHere, Δ\DeltaΔ means “change in”, TVTVTV means total value, and QQQ means quantity.
If quantity increases by exactly one unit, the marginal value is simply the difference between the two totals. If quantity increases by more than one unit, you must divide by the change in quantity.
Calculating marginal cost and marginal revenue
A bakery increases sandwich output from 100 to 120 sandwiches per day. Total cost rises from £260 to £340. Total revenue rises from £500 to £580.
- Calculate the change in quantity: output rises from 100 to 120, so ΔQ=20\Delta Q = 20ΔQ=20 sandwiches.
- Calculate marginal cost: total cost rises by £80, so MC=£8020=£4MC = \frac{\text{£}80}{20} = \text{£}4MC=20£80=£4 per sandwich.
- Calculate marginal revenue: total revenue rises by £80, so MR=£8020=£4MR = \frac{\text{£}80}{20} = \text{£}4MR=20£80=£4 per sandwich.
- Interpret the result: each extra sandwich adds £4 to cost and £4 to revenue, so this extra batch adds no extra profit before considering other complications.
Confusing marginal and average
Average means “per unit across all units”. Marginal means “from the extra unit or extra batch”. Average cost might be £3.40 per sandwich, while marginal cost could be £4 per sandwich.
Utility: satisfaction from consumption
To explain consumer demand, economists use the idea of utility.
Utility
Utility means the satisfaction, benefit or usefulness a consumer gains from consuming a good or service.
Utility is not usually measured directly in real life. In theory and calculations, economists sometimes use imaginary units called utils to show satisfaction.
There are two types you need for this topic.
Total utility and marginal utility
Total utility is the overall satisfaction gained from consuming a given quantity of a good. Marginal utility is the extra satisfaction gained from consuming one more unit.
MU=ΔTUΔQMU = \frac{\Delta TU}{\Delta Q}MU=ΔQΔTUHere, MUMUMU is marginal utility and TUTUTU is total utility.
If total utility rises, marginal utility is positive. If total utility stays the same, marginal utility is zero. If total utility falls, marginal utility is negative.
Calculating marginal utility
A student gets the following total utility from slices of pizza: 0 slices gives 0 utils, 1 slice gives 20 utils, 2 slices gives 35 utils, 3 slices gives 45 utils, 4 slices gives 50 utils, and 5 slices gives 48 utils.
- Compare 0 to 1 slice: total utility rises from 0 to 20, so marginal utility is 20 utils.
- Compare 1 to 2 slices: total utility rises from 20 to 35, so marginal utility is 15 utils.
- Compare 2 to 3 slices: total utility rises from 35 to 45, so marginal utility is 10 utils.
- Compare 3 to 4 slices: total utility rises from 45 to 50, so marginal utility is 5 utils.
- Compare 4 to 5 slices: total utility falls from 50 to 48, so marginal utility is negative 2 utils.
Diminishing marginal utility
In many situations, each extra unit gives less additional satisfaction than the previous one.
Diminishing marginal utility
Diminishing marginal utility is the idea that, as a consumer consumes more units of a good in a given period, the extra utility gained from each additional unit tends to fall.
The first slice of pizza when you are hungry may give a lot of satisfaction. The fourth slice may still be enjoyable, but it probably adds less extra satisfaction. The sixth slice might even reduce total satisfaction if you feel uncomfortably full.
The diagram below links total utility, marginal utility and demand.
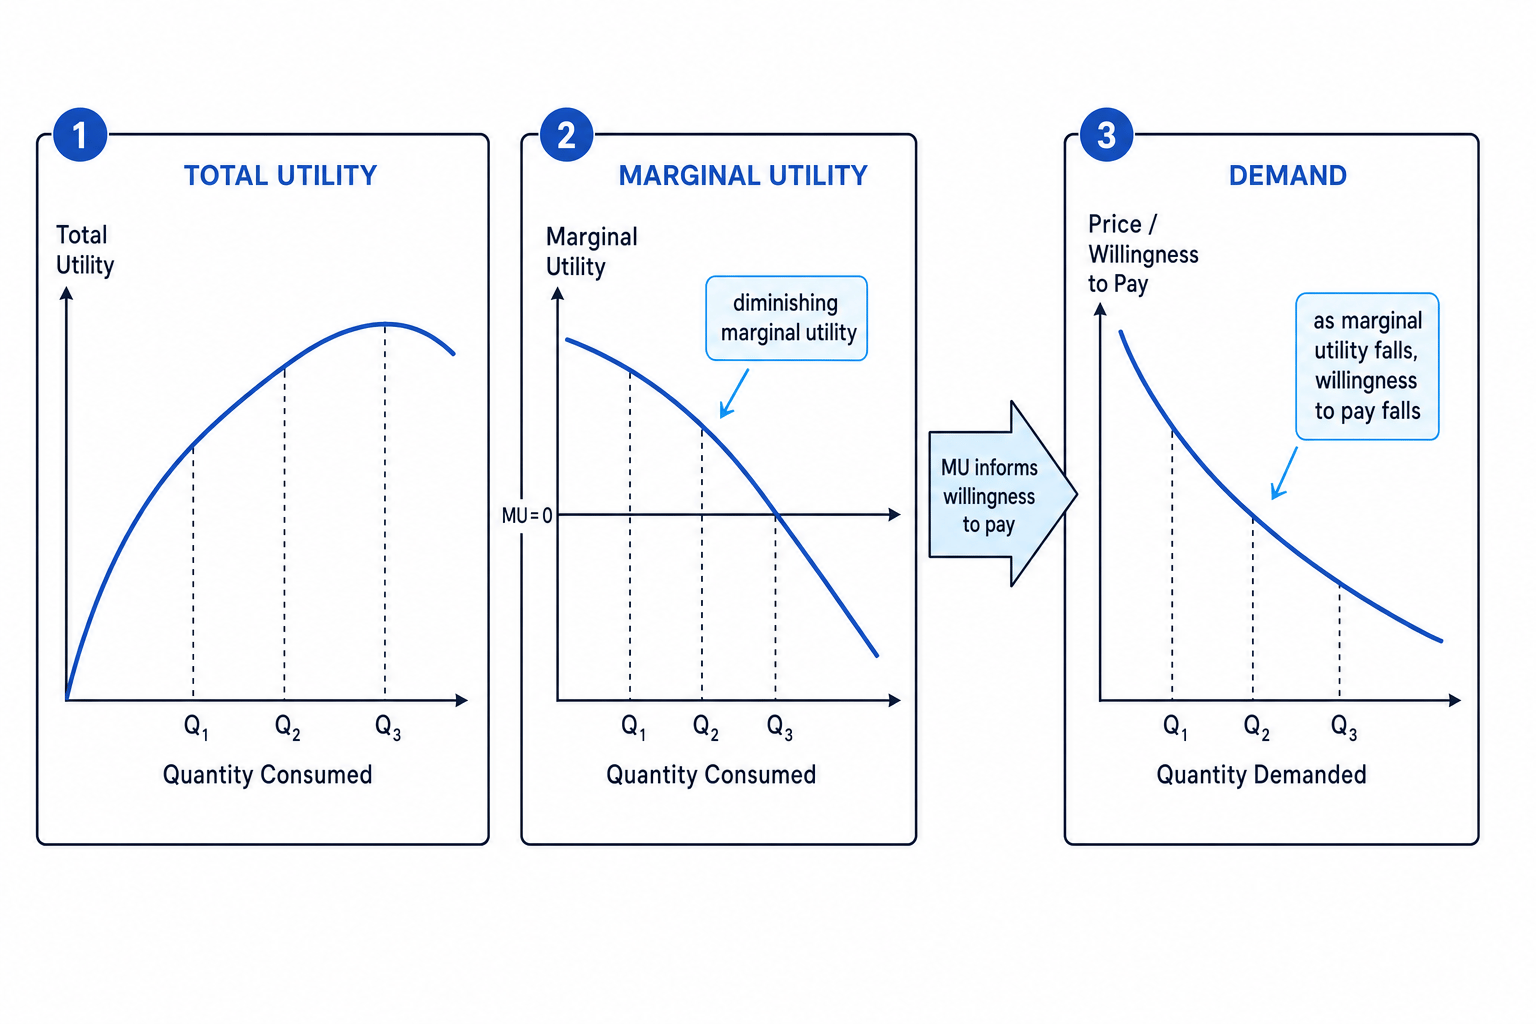
The important relationship is:
- While marginal utility is positive, total utility rises.
- As marginal utility falls, total utility rises more slowly.
- When marginal utility reaches zero, total utility is at its maximum.
- If marginal utility becomes negative, total utility falls.
Remember the relationship
Marginal utility is the slope of total utility. If total utility is still rising but getting flatter, marginal utility is positive but falling.
From marginal utility to the demand curve
A demand curve shows the quantity of a good consumers are willing and able to buy at different prices, ceteris paribus. Ceteris paribus means “all other things being equal”.
Demand curve
A demand curve shows the relationship between price and quantity demanded, assuming other factors such as income, tastes and prices of related goods stay unchanged.
Diminishing marginal utility helps explain why demand curves usually slope downwards.
Consumers are willing to pay more for units that give high marginal utility. As they consume more, each extra unit gives lower marginal utility, so their willingness to pay falls.
Willingness to pay
Willingness to pay is the maximum price a consumer is prepared to pay for a unit of a good or service.
So, to persuade consumers to buy more units, the price usually has to fall. This gives the normal downward-sloping demand curve.
Using marginal utility to find quantity demanded
A consumer’s willingness to pay for bottles of juice is: first bottle £3.00, second bottle £2.40, third bottle £1.80, fourth bottle £1.20.
- At a price of £2.50, compare price with willingness to pay: only the first bottle gives benefit worth at least £2.50, so quantity demanded is 1 bottle.
- If price falls to £2.00, the first and second bottles are now worth buying, so quantity demanded rises to 2 bottles.
- If price falls to £1.50, the first, second and third bottles are worth buying, so quantity demanded rises to 3 bottles.
- This shows a movement along the demand curve: a lower price makes extra units worthwhile because their marginal utility is lower.
Mixing up movements and shifts
Diminishing marginal utility helps explain a movement along a demand curve when price changes. A shift of demand happens when another factor changes, such as income, tastes, advertising, population or the price of a substitute/complement.
Why marginal thinking matters in markets
The concept of the margin is central to the role of markets because prices guide decisions.
For consumers, price is compared with marginal benefit. If the extra satisfaction from a good is worth more than the price, the consumer buys it.
For firms, price and revenue are compared with marginal cost. A firm may expand output if the extra revenue from selling more is greater than the extra cost of producing it.
For governments, marginal thinking appears in cost-benefit analysis. For example, an extra £1 billion of green-transition spending may generate benefits such as lower emissions, improved energy security and new jobs, but it also has an opportunity cost because that money could have been used elsewhere.
Marginal analysis is a model
Marginal utility theory is useful, but real consumers do not always calculate perfectly. Habits, addiction, imperfect information, social pressure, branding and the cost-of-living squeeze can all affect choices.
Bringing it together
The margin is about the extra unit. Marginal utility is the extra satisfaction from consuming one more unit. Because marginal utility often diminishes, consumers usually need a lower price to buy additional units. This helps explain the downward-sloping demand curve.
The calculation technique is always the same: compare the change in the total with the change in quantity.
In the exam
- Define “marginal” clearly as the extra or next unit being considered.
- For calculations, show the change in the total and divide by the change in quantity, carrying units such as £ per unit or utils per unit.
- When explaining demand, link the chain carefully: more consumption → falling marginal utility → lower willingness to pay → downward-sloping demand curve.
Check yourself
- What is the difference between total utility and marginal utility?
- If total cost rises by £150 when output rises by 30 units, what is marginal cost per unit?
- Why does diminishing marginal utility help explain the shape of the demand curve?
