An aerospace engineering firm is evaluating its long-run production costs to determine its optimum scale of operation. The diagram below illustrates the firm's Long-Run Average Cost (LRACLRACLRAC) curve.
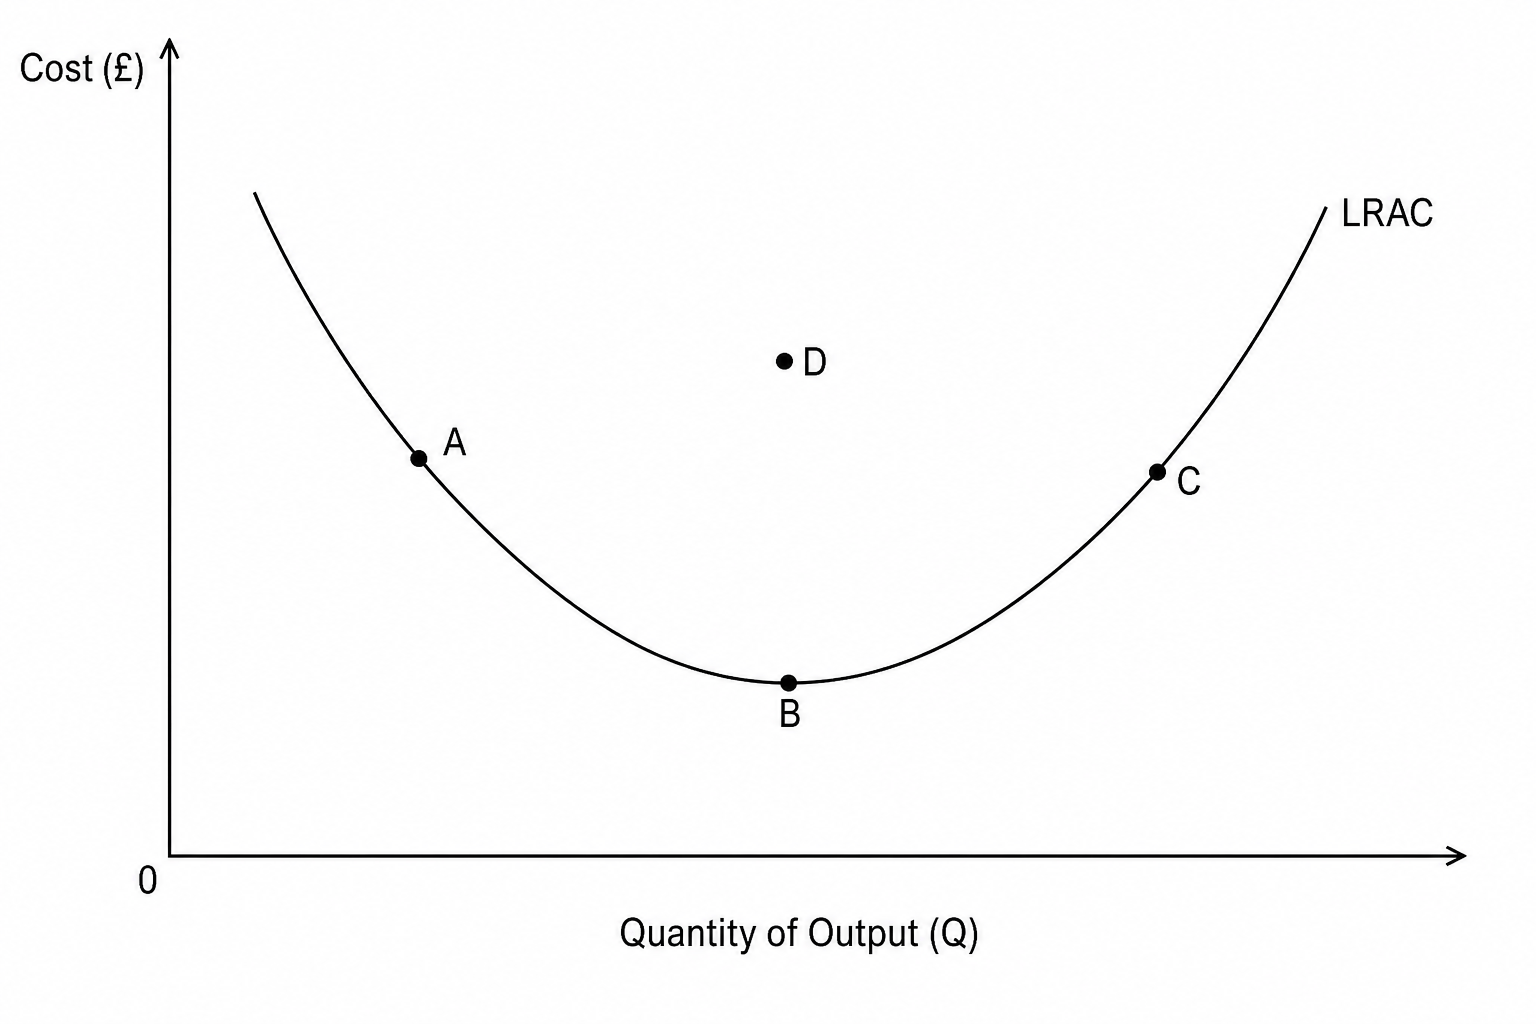
Which of the following statements correctly identifies the economic state represented by one of the labeled points on the diagram?
Point A represents a state of productive efficiency where the firm experiences constant returns to scale.
Point B represents the Minimum Efficient Scale, where long-run productive efficiency is achieved.
Point C represents the point of maximum profit where the firm benefits from further economies of scale.
Point D represents a situation of allocative efficiency because production costs are higher than average.

