Skip to content
MathsGenie logo
Open app

Course home

  1. A Level
  2. Economics OCR
  3. Question bank

Costs and economies of scale

EasyMediumHard
12345678910111213141516171819
Question 9

The diagram below shows a manufacturing firm's Long-run Average Cost (LRAC) curve.
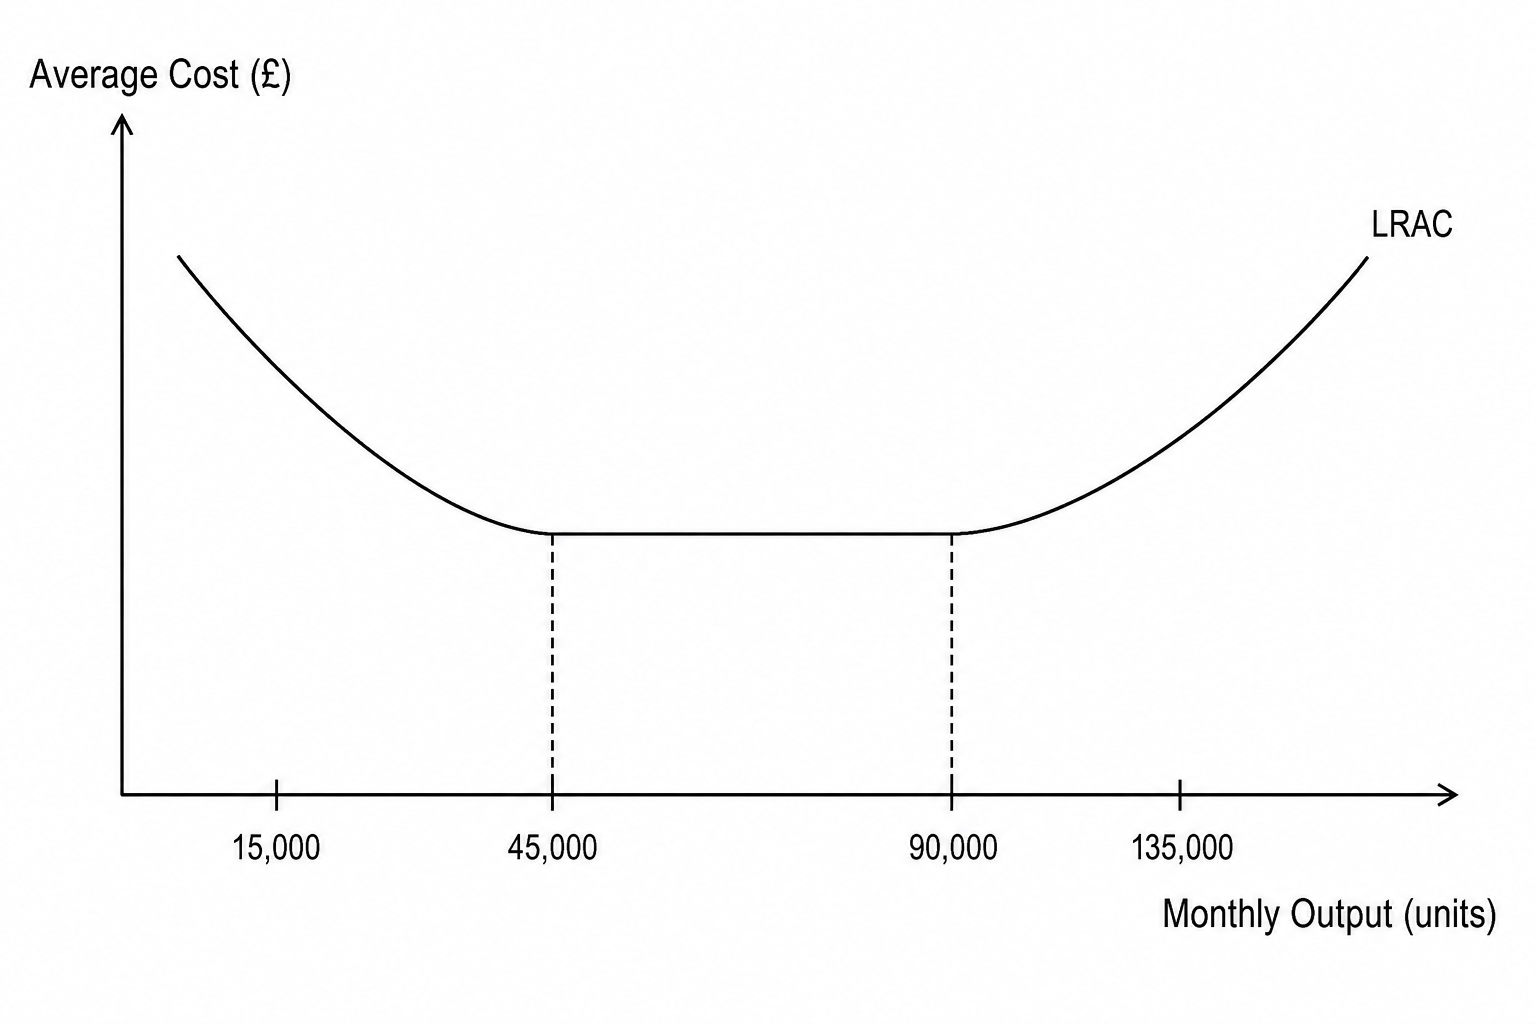
A graph showing a Long-run Average Cost (LRAC) curve with average cost on the vertical axis and monthly output on the horizontal axis. Output levels are marked at 15,000, 45,000, 90,000, and 135,000 units.

Which level of monthly output represents the firm's Minimum Efficient Scale (MES)?

15,000 units15,000\text{ units}15,000 units

90,000 units90,000\text{ units}90,000 units

45,000 units45,000\text{ units}45,000 units

135,000 units135,000\text{ units}135,000 units

Costs and economies of scale Questions

  1. A Level
  2. /Economics
  3. /Costs and economies of scale
