The diagram below shows a firm's Short-Run Average Cost (SRACSRACSRAC) curves and its Long-Run Average Cost (LRACLRACLRAC) curve.
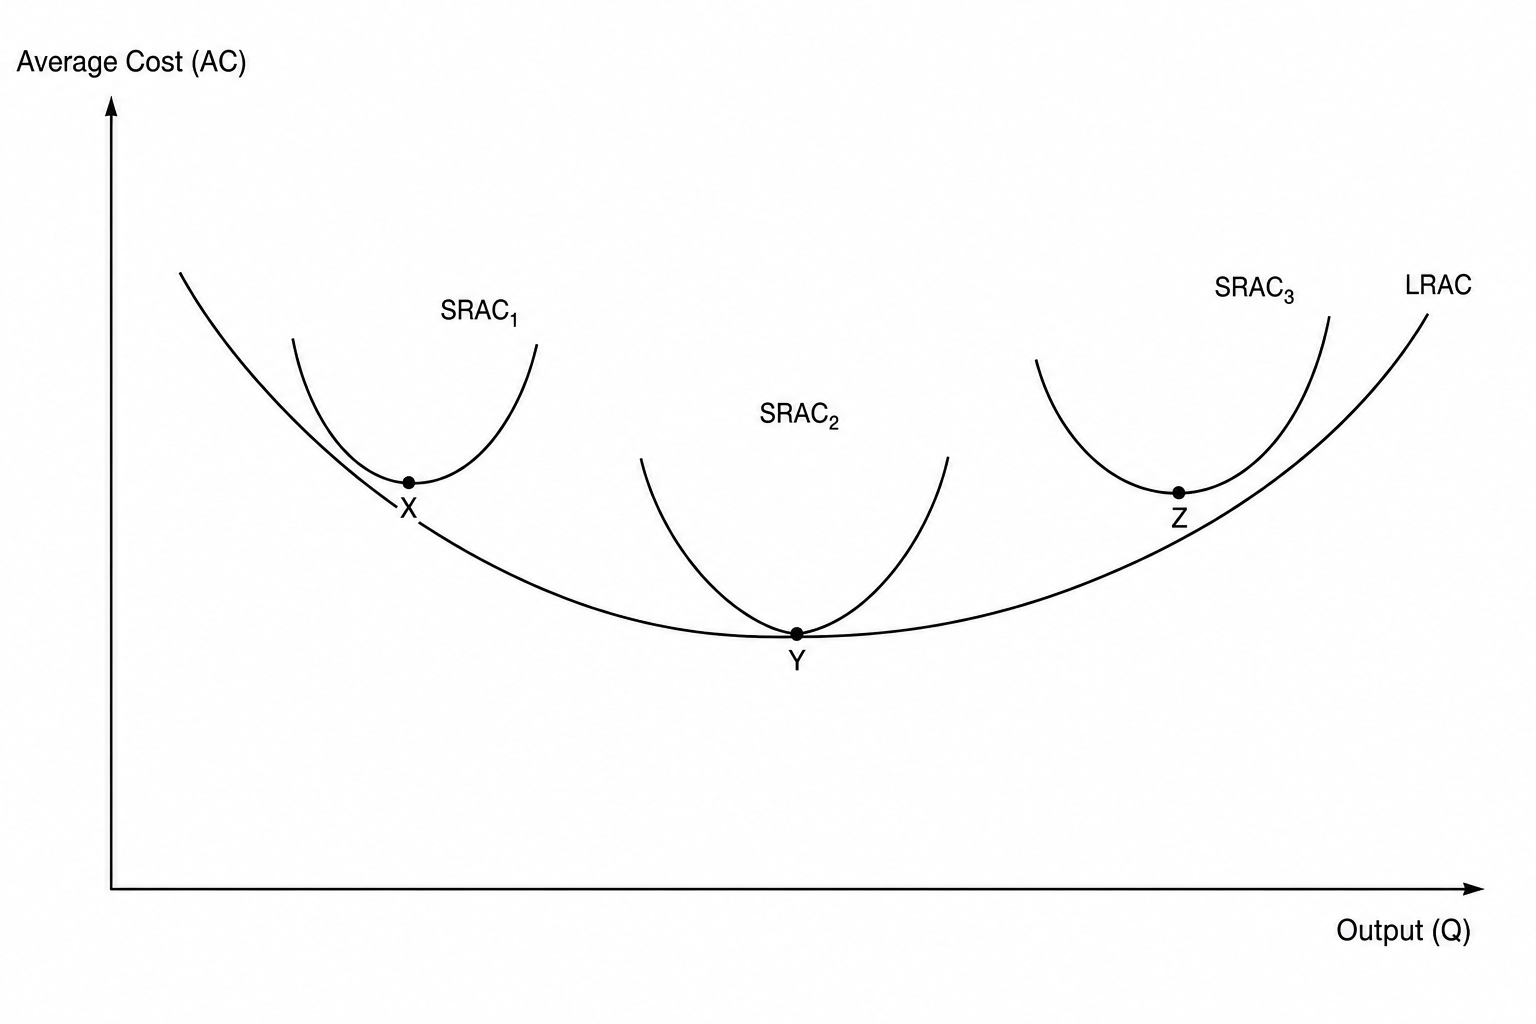
Which of the following statements is correct regarding the firm's cost structure and scale of production?
A transition from point X to point Y along the LRACLRACLRAC curve represents the firm experiencing economies of scale.
A movement along SRAC1SRAC_1SRAC1 from left to right down to point X represents the firm achieving long-run economies of scale.
A transition from point Y to point Z along the LRACLRACLRAC curve represents the firm experiencing increasing returns to scale.
A transition from point X to point Y represents a short-run expansion where at least one factor of production remains fixed.

