

What you'll learn
- What aggregate supply means in a macroeconomy.
- Why short-run aggregate supply slopes upwards.
- Why long-run aggregate supply is usually drawn as vertical at full-employment output.
- How to explain shifts in AS in the short run and long run using diagrams.
The basics you need first
Price level and real GDP
The price level is the average level of prices across the whole economy. In the UK, it is commonly measured using an index such as the Consumer Prices Index, where a chosen base year equals 100.
Real GDP is the value of national output after adjusting for inflation. It tells you how much the economy is actually producing, not just whether prices have risen.
On an aggregate supply diagram:
- The vertical axis shows the price level.
- The horizontal axis shows real GDP, or national output.
Short run and long run
In macroeconomics, the short run is the period in which some costs, especially wages and contracts, are fixed or slow to change. Firms may respond to higher prices by producing more because their costs have not yet fully caught up.
The long run is the period in which wages, input prices, expectations, and contracts have adjusted. In the long run, the economy’s output depends more on its productive capacity than on the current price level.
Potential output
Potential output, often labelled YFEY_{FE}YFE, is the maximum sustainable level of real GDP the economy can produce when resources are used at normal full capacity, without creating accelerating inflationary pressure.
What is aggregate supply?
Aggregate supply
Aggregate supply is the total amount of real output that firms in an economy are willing and able to produce at different price levels over a given period of time.
Aggregate supply is the macroeconomic version of supply. Instead of asking how many units one firm will produce, we ask how much the whole economy will produce.
It depends on both:
- Costs of production, such as wages, energy prices, raw materials, taxes, and regulation.
- Productive capacity, such as the size and skills of the labour force, the capital stock, technology, infrastructure, and institutions.
The big idea
Aggregate supply helps explain whether growth is sustainable. If output rises because firms temporarily work harder, that is different from output rising because the economy’s productive capacity has increased.
Classifying an aggregate supply change
Suppose UK firms face a sharp rise in wholesale gas prices.
-
Identify what has changed: gas is an input cost for many firms, directly for energy-intensive industries and indirectly through transport and production costs.
-
Decide whether this mainly affects current costs or long-term capacity: a gas price rise usually raises costs now, but it does not automatically reduce the UK’s long-term productive capacity.
-
Classify the effect: this is mainly a short-run aggregate supply shift to the left, because firms can produce less profitably at each price level.
Short-run aggregate supply
Short-run aggregate supply
Short-run aggregate supply, or SRAS, shows the relationship between the price level and real output when some input costs are fixed or slow to adjust.
The SRAS curve is usually drawn as upward sloping. This means a higher price level is associated with a higher level of real GDP in the short run.
The main reason is that some costs are sticky. A sticky cost is a cost that does not change immediately. Wages, rent contracts, and supplier agreements may be fixed for months or years.
If firms can sell output at higher prices while some costs stay the same, profit margins rise. Firms then have an incentive to increase output, perhaps by using overtime, taking on temporary labour, or using spare capacity.
The diagram shows this short-run movement along SRAS, and compares it with long-run aggregate supply.
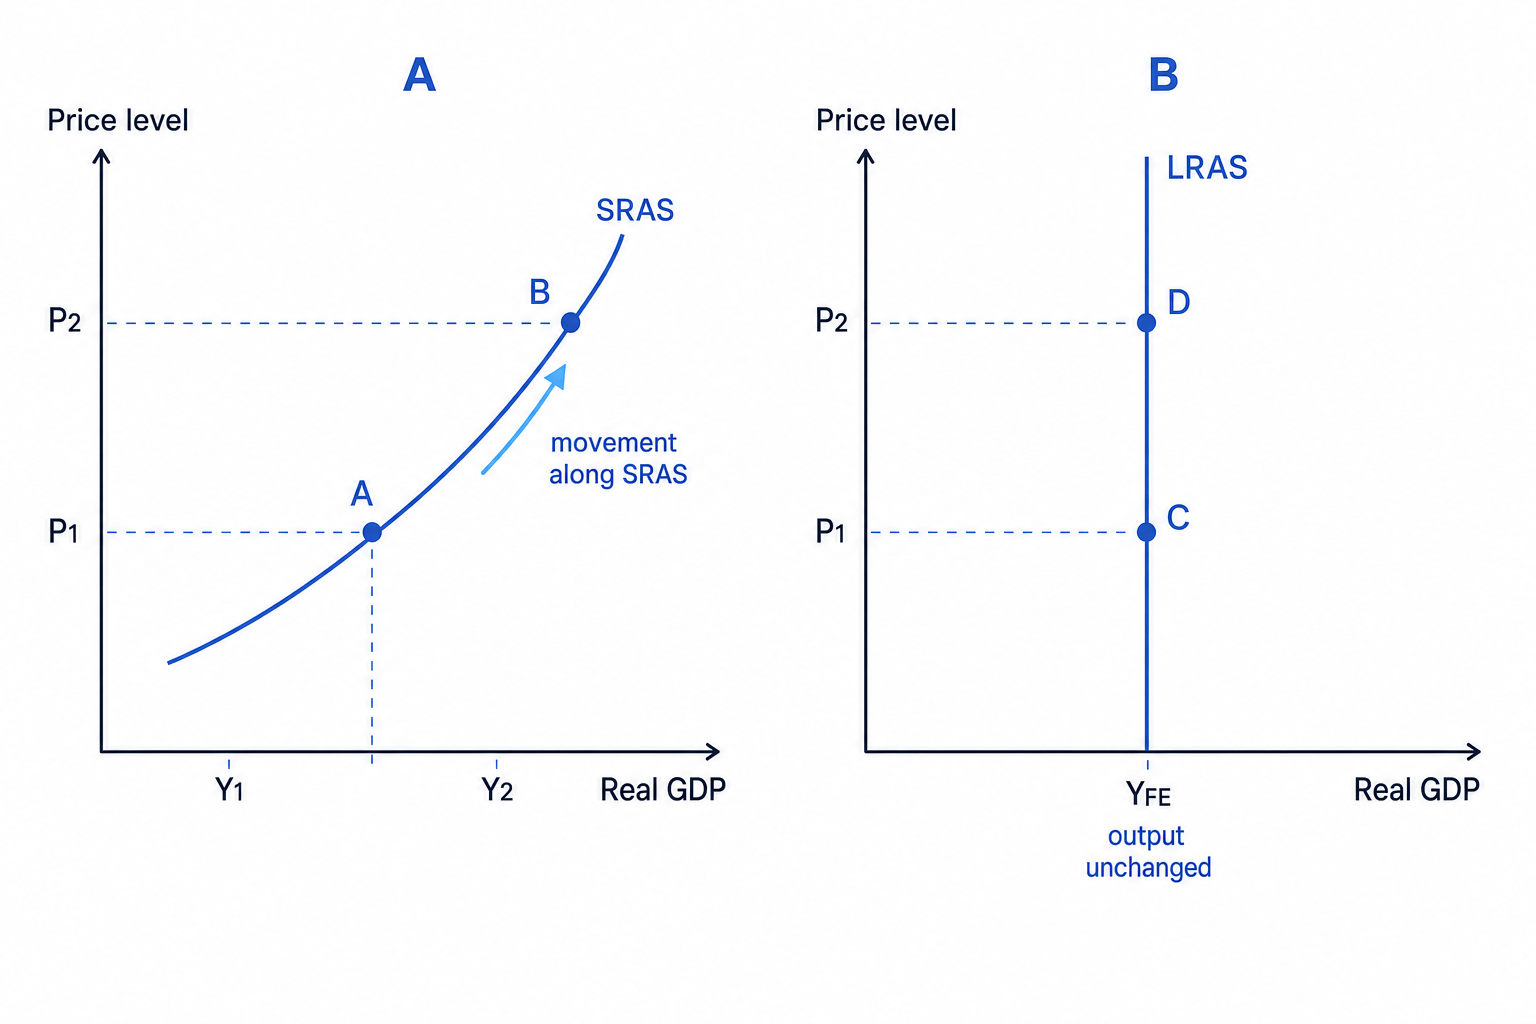
Moving along SRAS after a price-level rise
Suppose the price level rises from P1P_1P1 to P2P_2P2, while wages and other input costs are slow to adjust.
-
Compare prices and costs: output prices have risen, but some production costs have not risen by the same amount yet, so firms’ profit margins improve.
-
Apply the SRAS relationship: firms are willing to expand production, so real GDP rises from Y1Y_1Y1 to Y2Y_2Y2.
-
Describe the diagram: this is a movement up along the existing SRAS curve, not a shift of the curve, because the underlying costs and capacity have not changed.
Movement versus shift
A change in the price level causes a movement along SRAS. A change in costs, productivity, or productive capacity causes the whole AS curve to shift.
Long-run aggregate supply
Long-run aggregate supply
Long-run aggregate supply, or LRAS, shows the economy’s maximum sustainable output when wages and input prices have fully adjusted.
In the standard neo-classical model, LRAS is drawn as a vertical line at YFEY_{FE}YFE.
This means that, in the long run, a higher price level does not permanently increase real GDP. If all prices and wages adjust, firms are not better off just because the general price level is higher. Real output depends on real factors: labour, capital, technology, enterprise, and efficiency.
This idea is linked to the concept of money neutrality: in the long run, changes in nominal variables such as the price level do not necessarily change real output.
Think real, not nominal
In the long run, ask: has the economy gained more workers, better skills, more capital, better technology, or improved efficiency? If not, LRAS probably has not shifted.
Comparing short-run and long-run responses
Suppose a boom in aggregate demand pushes up the price level.
-
In the short run, some wages and costs are sticky, so firms may increase output. The economy can move up along SRAS.
-
Over time, workers and suppliers demand higher wages and prices to reflect the higher cost of living. Firms’ costs rise.
-
In the long run, the temporary profit incentive disappears, so output returns towards YFEY_{FE}YFE unless productive capacity has increased.
A Keynesian note
Some economists, especially Keynesians, argue that aggregate supply may be very elastic when there is lots of spare capacity. In a deep recession, firms may be able to raise output without much upward pressure on prices.
For OCR diagrams, the key contrast is still: SRAS slopes upward, while LRAS represents the economy’s productive capacity. But in essays, you can use Keynesian reasoning to explain why the impact of demand growth may depend on how much spare capacity exists.
Shifts in short-run aggregate supply
A shift in SRAS means firms are willing and able to produce a different amount at every price level.
SRAS shifts right when production becomes cheaper or more efficient. SRAS shifts left when production becomes more expensive or disrupted.
Common causes of SRAS shifts include:
| Cause | Likely SRAS effect | Explanation |
|---|---|---|
| Lower energy prices | Shift right | Firms’ unit costs fall |
| Higher wages not matched by productivity | Shift left | Labour costs per unit rise |
| Improved productivity | Shift right | More output can be produced from the same inputs |
| Weaker pound increasing import costs | Shift left | Imported raw materials and components become more expensive |
| Business taxes rise | Shift left | Costs increase at each output level |
| Subsidies for production | Shift right | Effective costs fall |
| Supply-chain disruption | Shift left | Firms struggle to access inputs |
Productivity means output per unit of input, often output per worker or output per hour. Unit labour cost means the labour cost involved in producing one unit of output.
The diagram shows short-run and long-run aggregate supply shifts.
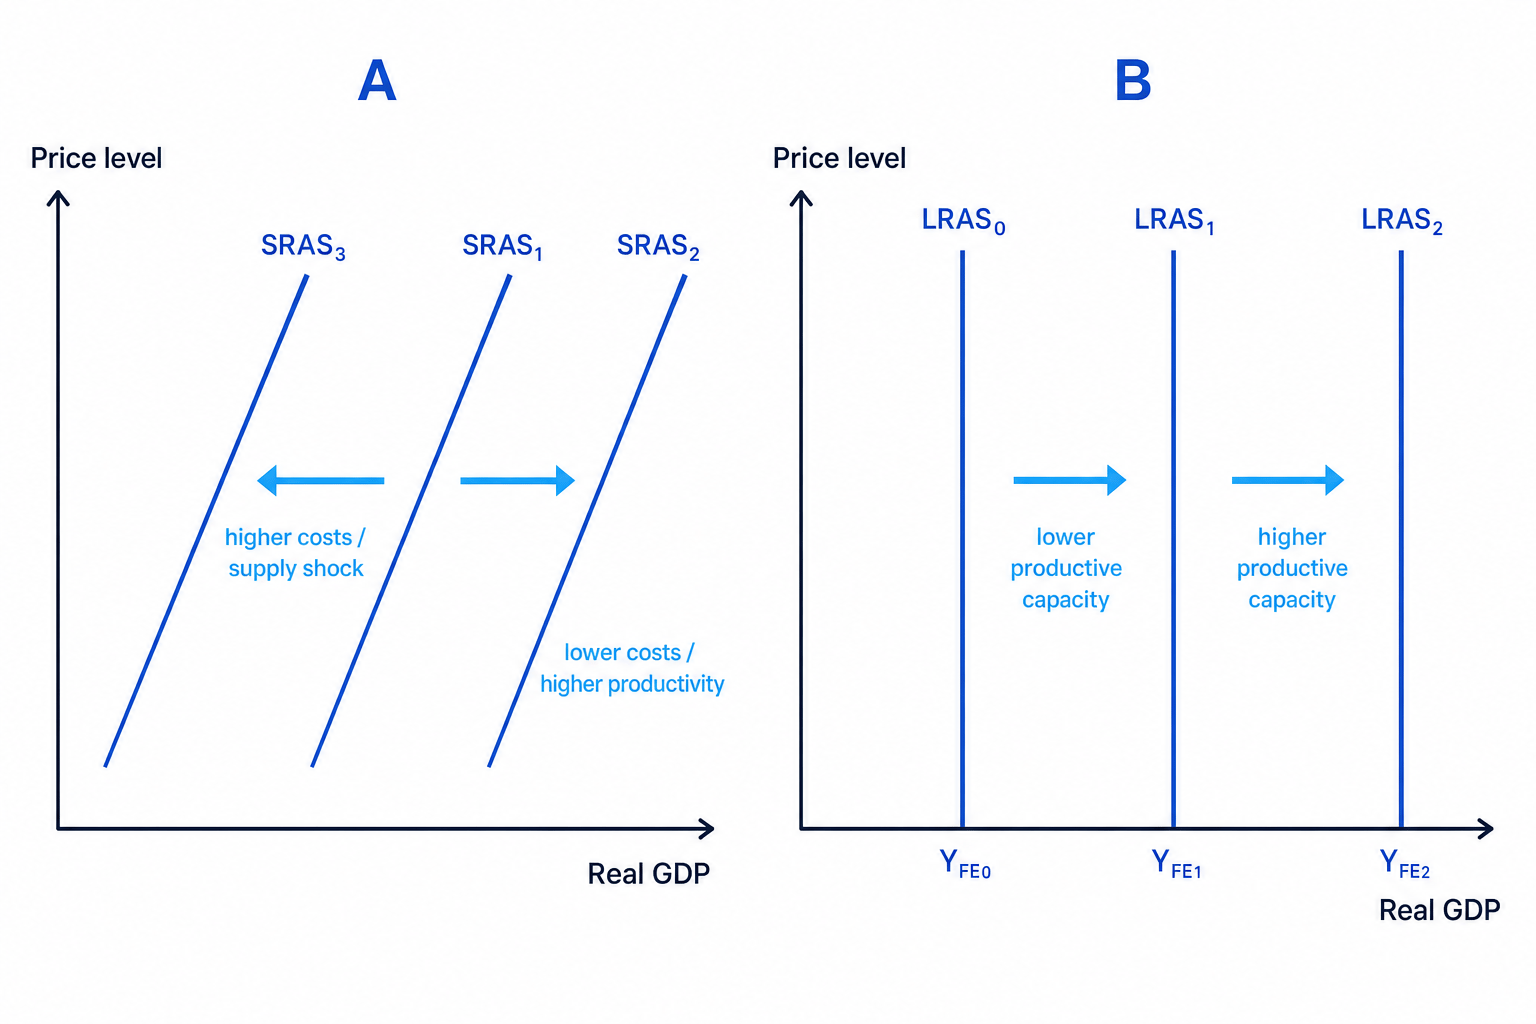
Analysing a cost-push shock
Suppose global oil prices rise sharply and UK transport firms face higher fuel costs.
-
Identify the type of change: oil is a key input, so this is a rise in production costs rather than a rise in productive capacity.
-
Apply it to SRAS: at each price level, firms are less willing or able to supply output profitably, so SRAS shifts left.
-
Analyse the macro effect if aggregate demand is unchanged: the economy faces upward pressure on inflation and downward pressure on real GDP, a situation known as stagflation.
Stagflation
Stagflation is when an economy experiences weak or falling real output alongside high inflation. It is often linked to negative supply shocks.
The UK cost-of-living squeeze after 2021 is a useful AO2 example. Higher energy prices, global supply-chain disruption, and imported inflation raised firms’ costs. This helped shift SRAS left, contributing to higher inflation and weaker real income growth.
Shifts in long-run aggregate supply
A shift in LRAS means the economy’s productive capacity has changed.
LRAS shifts right when potential output increases. This is a form of long-run economic growth.
LRAS may shift right because of:
- Higher investment in capital goods, such as machinery, factories, digital systems, and transport networks.
- Improved education and training, which raises human capital.
- Technological progress, including automation and artificial intelligence.
- Higher labour-force participation or net migration increasing labour supply.
- Better infrastructure, such as rail, broadband, energy grids, and ports.
- Stronger institutions, competition, and incentives for enterprise.
LRAS shifts left if productive capacity is damaged or reduced. This could happen because of war, natural disasters, long-term labour shortages, persistent underinvestment, or a fall in productivity.
Identifying a long-run capacity change
Suppose the government funds major improvements in rail links, broadband, and technical education.
-
Identify whether the policy affects capacity: better infrastructure and skills allow workers and firms to produce more efficiently over time.
-
Decide the curve affected: because the economy’s maximum sustainable output has increased, LRAS shifts right.
-
Add evaluation: the effect may be large in the long run, but it depends on project quality, delivery speed, opportunity cost, and whether private firms respond with investment.
Short run costs, long run capacity
SRAS shifts are mainly about costs and temporary efficiency. LRAS shifts are mainly about productive potential.
When can both SRAS and LRAS shift?
Some changes affect both the short run and the long run.
For example, a major improvement in productivity can lower unit costs now, shifting SRAS right, and increase potential output over time, shifting LRAS right.
By contrast, a temporary spike in oil prices usually shifts SRAS left but may not shift LRAS unless it permanently changes investment, technology, or labour supply.
Do not assume every shock is permanent
A supply shock only shifts LRAS if it changes the economy’s productive capacity. Temporary cost changes usually affect SRAS, not LRAS.
Bringing it together for essays
Aggregate supply analysis is powerful because it links inflation, growth, employment, and living standards.
A rightward shift in SRAS can reduce inflationary pressure and raise real GDP in the short run. A rightward shift in LRAS is even more important because it allows sustainable growth without the same inflationary pressure.
However, supply-side improvements often take time. Education reforms, infrastructure projects, planning reform, and green-transition investment may raise LRAS, but effects depend on implementation, funding, and business confidence.
In evaluation, compare:
- Short run versus long run: cost shocks may hit quickly; productivity gains may take years.
- Magnitude: a small tax change may matter less than a global energy shock.
- Duration: temporary bottlenecks differ from structural labour shortages.
- Trade-offs: deregulation may reduce costs but risk lower standards; green investment may raise costs now but improve energy security later.
In the exam
-
Define aggregate supply clearly as total real output supplied at different price levels.
-
Label diagrams fully: price level on the vertical axis, real GDP on the horizontal axis, and SRAS or LRAS clearly named.
-
Separate movements from shifts: price-level changes move along SRAS; costs, productivity, and capacity shift the curve.
-
For LRAS, focus on productive capacity: labour, capital, technology, infrastructure, institutions, and productivity.
Check yourself
-
Why does SRAS slope upwards in the short run?
-
What is the difference between a leftward SRAS shift and a leftward LRAS shift?
-
How could investment in skills and infrastructure affect both inflation and real GDP over time?
