The interaction of aggregate demand and supply
What you'll learn
- How aggregate demand and aggregate supply are used to model the whole economy.
- The key assumptions behind AD/AS diagrams.
- How macroeconomic equilibrium is found and interpreted.
- How shifts in AD and AS affect growth, inflation, unemployment and the current account.
Start with the big picture
The aggregate demand and aggregate supply model is a way of analysing the whole macroeconomy. Instead of looking at one market, such as coffee or labour, it looks at the relationship between the general price level and real GDP.
Real GDP means the value of national output adjusted for inflation. In simple terms, it measures how much the economy is producing.
Aggregate demand and aggregate supply
- Aggregate demand (AD) is the total planned spending on goods and services in an economy at different price levels.
- Short-run aggregate supply (SRAS) is the total output firms are willing and able to supply at different price levels when some costs, such as wages, are sticky.
- Long-run aggregate supply (LRAS) is the economy’s productive potential: the maximum sustainable level of real output when resources are fully and efficiently used.
- The price level is the average level of prices across the economy. It is not the same as inflation, which is the rate of change of the price level.
Aggregate demand: planned spending
Aggregate demand is made up of four components:
AD=C+I+G+(X−M)AD = C + I + G + (X - M)AD=C+I+G+(X−M)where C is consumption, I is investment, G is government spending, X is exports and M is imports. Exports minus imports are called net exports.
AD slopes downwards because, as the price level rises, UK goods become less price competitive, the real value of money balances falls, and interest rates may rise if demand for money increases. These effects reduce planned spending.
Calculating aggregate demand
-
Suppose consumption is £1,500bn, investment is £350bn, government spending is £600bn, exports are £800bn and imports are £900bn. First calculate net exports: exports are £800bn and imports are £900bn, so net exports are -£100bn.
-
Add the components of planned expenditure: £1,500bn plus £350bn plus £600bn minus £100bn gives aggregate demand of £2,350bn.
-
If investment then rises by £40bn while imports rise by £10bn, the direct change in AD is +£30bn before considering any multiplier effect.
Aggregate supply: productive capacity and costs
SRAS slopes upwards because higher output usually increases pressure on firms’ costs. For example, firms may need to pay overtime, hire less suitable workers, or compete for scarce raw materials. If prices rise faster than costs, firms have an incentive to produce more.
LRAS shows what the economy can produce sustainably. It depends on supply-side factors such as the size and skills of the labour force, capital stock, technology, infrastructure, and institutional quality.
Short run versus long run
In the short run, changes in demand can affect real GDP because wages and prices do not fully adjust immediately. In the long run, sustained increases in real output require higher productive capacity, not just more spending.
Assumptions behind the AD/AS model
The AD/AS model is useful, but it rests on simplifying assumptions.
First, it assumes ceteris paribus, meaning “all other things being equal”. When you shift AD, you assume SRAS has not also changed unless the question gives you a reason.
Second, it assumes the economy can be represented by one general price level and one measure of real output. This hides regional, sectoral and distributional differences.
Third, the standard short-run model assumes some prices and wages are sticky. This is why an increase in AD can raise real GDP in the short run rather than only raising prices.
Fourth, the long-run model assumes productive potential is determined by real factors such as labour, capital and productivity. This is close to a neo-classical view. A more Keynesian view places greater emphasis on spare capacity and the possibility that weak demand can persist for a long time.
Do not over-read the diagram
AD/AS diagrams show direction and relative effects, not exact forecasts. A rightward shift drawn twice as far does not automatically mean real GDP doubles or inflation doubles.
Macroeconomic equilibrium
Macroeconomic equilibrium occurs where aggregate demand equals aggregate supply. In the short run, this is where AD intersects SRAS.
Macroeconomic equilibrium
Macroeconomic equilibrium is the combination of price level and real GDP where planned spending equals planned output, so firms have no unplanned build-up or run-down of inventories.
The diagram below shows AD, SRAS and LRAS. Equilibrium is at E, where AD and SRAS meet. Because Y1 is below Y*, the economy has a negative output gap.
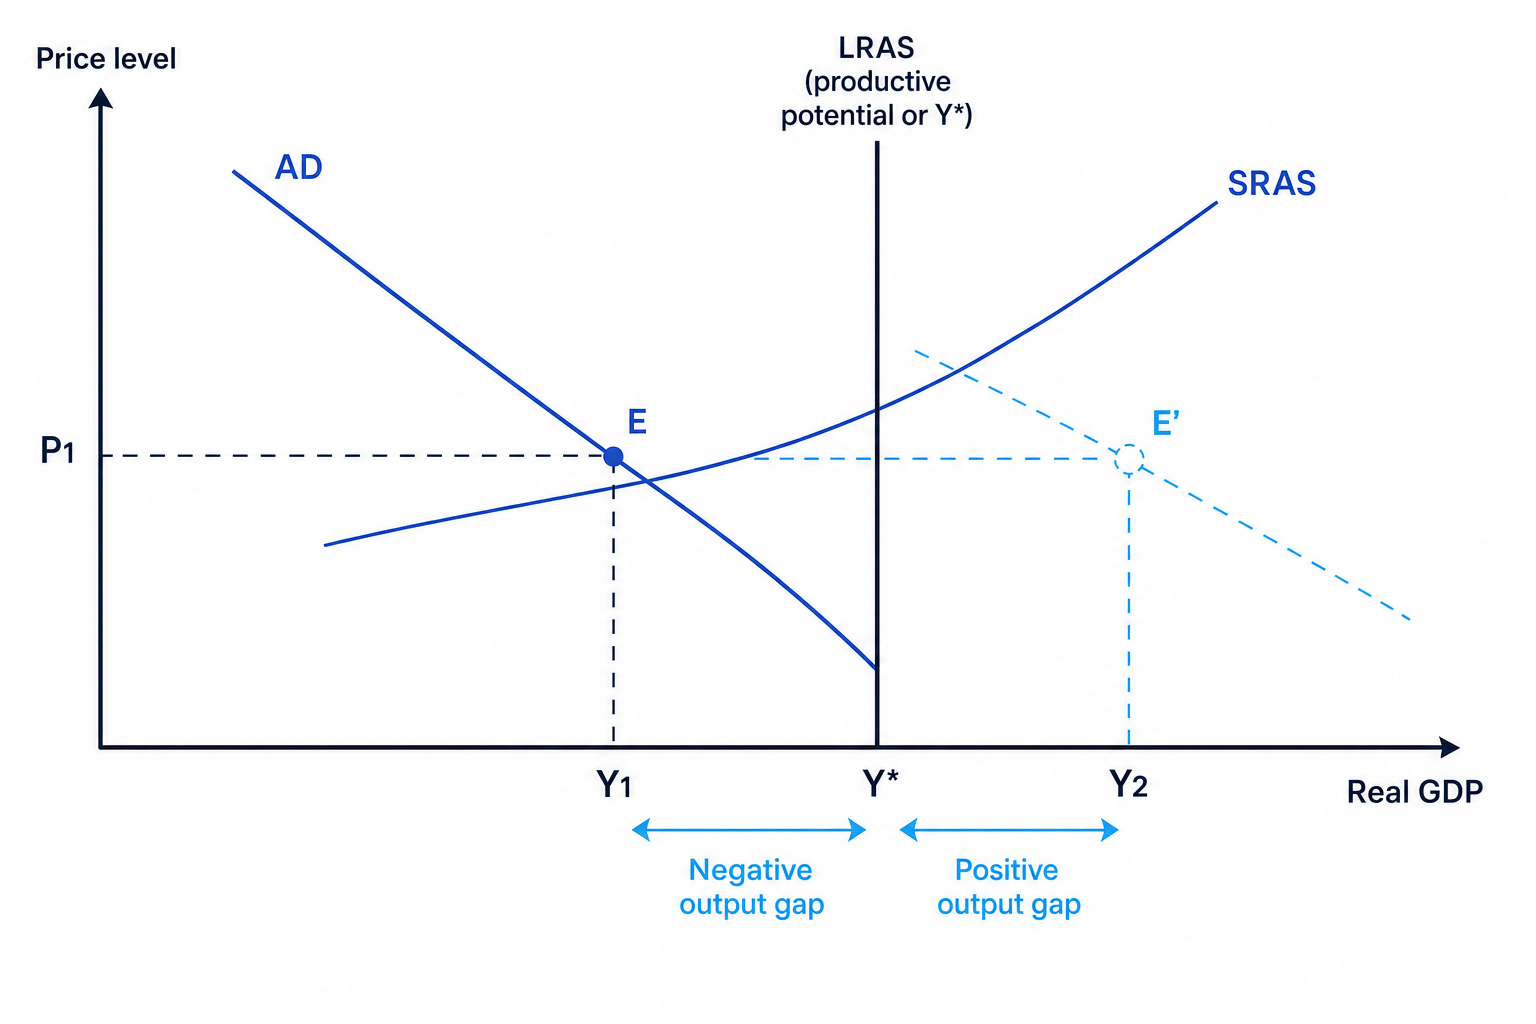
An output gap is the difference between actual real GDP and potential real GDP.
Output gap (%)=actual real GDP−potential real GDPpotential real GDP×100\text{Output gap (\%)} = \frac{\text{actual real GDP} - \text{potential real GDP}}{\text{potential real GDP}} \times 100Output gap (%)=potential real GDPactual real GDP−potential real GDP×100Calculating an output gap
-
Suppose actual real GDP is £2,340bn and potential real GDP is £2,400bn. The gap is £2,340bn minus £2,400bn, which is -£60bn.
-
Divide the gap by potential GDP: -£60bn divided by £2,400bn gives -0.025.
-
Convert to a percentage: -2.5%. This is a negative output gap, suggesting spare capacity and likely cyclical unemployment.
Confusing price level with inflation
The vertical axis shows the price level, not inflation. If the price level rises from P1 to P2, inflation is positive during that adjustment, but inflation means the percentage change in the price level over time.
Shifts in AD and AS
A movement along a curve is caused by a change in the price level. A shift of a curve is caused by a non-price factor.
AD shifts right if consumption, investment, government spending or net exports increase. For example, lower interest rates may increase borrowing and spending, while higher overseas growth may increase UK exports.
SRAS shifts right if production costs fall or productivity rises. For example, cheaper energy, lower indirect taxes, or improved supply chains can increase SRAS. SRAS shifts left if costs rise, such as during an oil price shock or major supply-chain disruption.
LRAS shifts right when productive potential increases. This might come from education, infrastructure, business investment, migration, innovation or institutional reform.
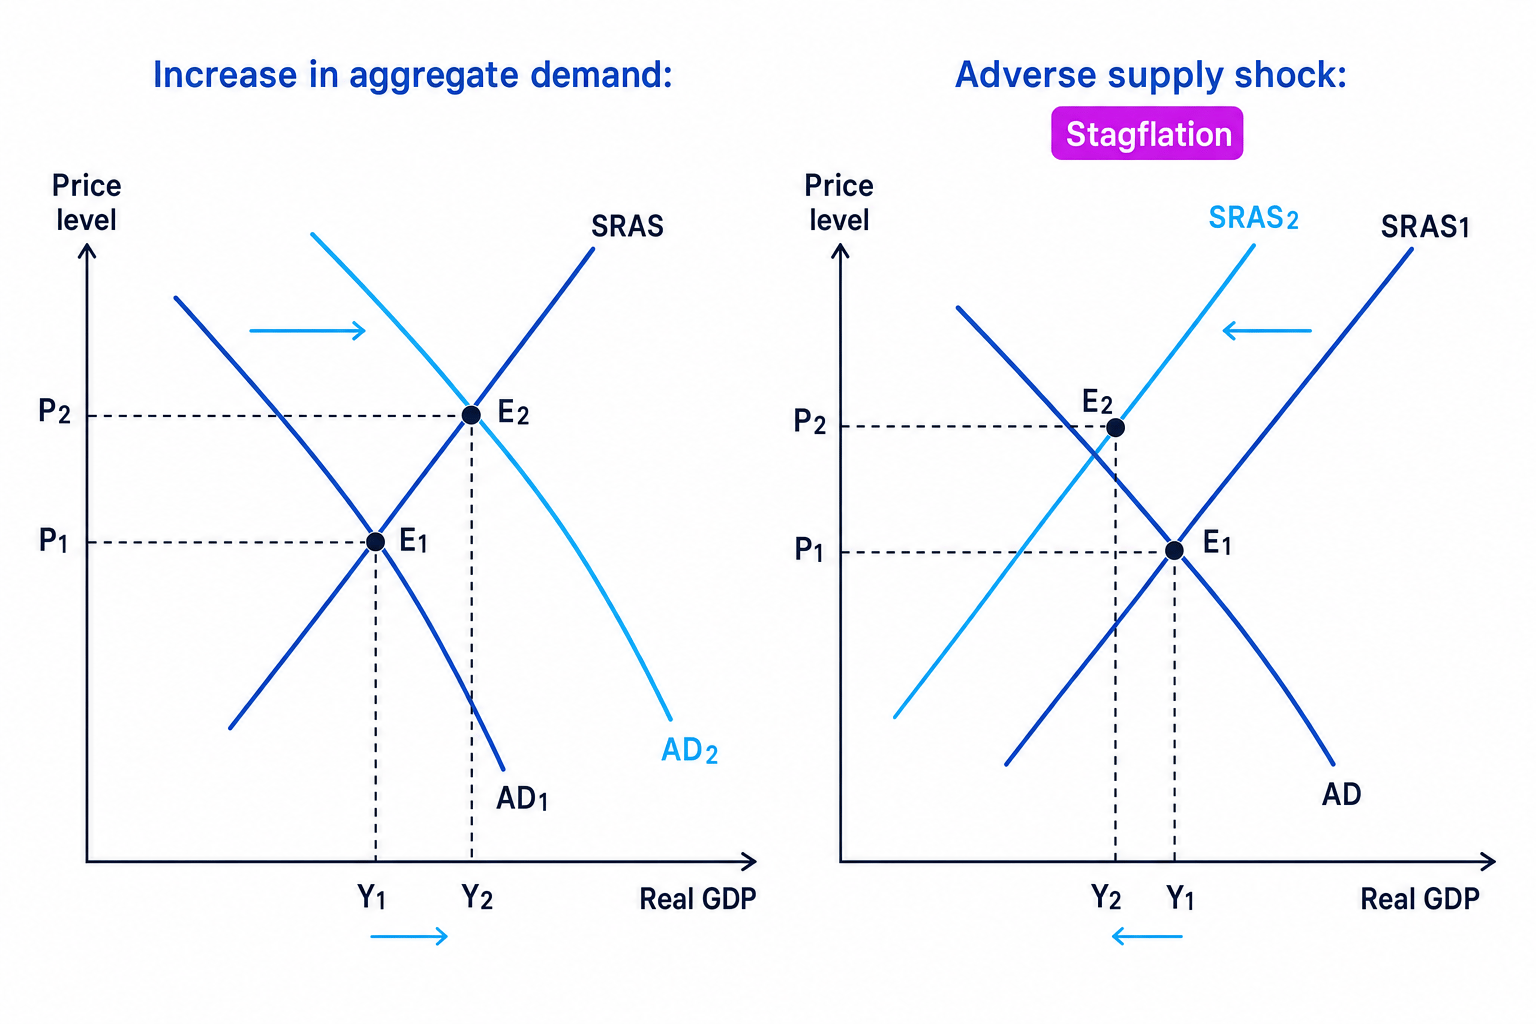
The next diagram compares a demand-side expansion with an adverse supply shock.
Effects on macroeconomic indicators
The key macroeconomic indicators are economic growth, inflation, unemployment and the current account of the balance of payments. The current account records flows such as trade in goods and services, plus income flows.
| Change | Real GDP and growth | Inflation or price level | Unemployment | Current account |
|---|---|---|---|---|
| AD shifts right | Real GDP rises in the short run | Price level rises; demand-pull inflationary pressure | Usually falls as firms hire more labour | May worsen as imports rise and exports become less competitive |
| AD shifts left | Real GDP falls or grows more slowly | Inflationary pressure falls | Usually rises | May improve as imports fall |
| SRAS shifts right | Real GDP rises | Price level falls or inflation slows | Usually falls | May improve if exports become more competitive |
| SRAS shifts left | Real GDP falls | Price level rises; cost-push inflation | Usually rises | Ambiguous: weaker growth reduces imports, but import costs may rise |
A leftward shift in SRAS is especially difficult because it can cause stagflation: rising inflation and falling real output at the same time. The UK’s post-pandemic energy and supply-chain pressures are useful AO2 context here, as they increased firms’ costs and contributed to the cost-of-living squeeze.
Analysing an oil price shock
-
Oil is a key input for transport, production and heating, so a rise in oil prices increases firms’ costs. This shifts SRAS left.
-
The new equilibrium has a higher price level and lower real GDP. This means cost-push inflation rises while output falls.
-
Lower output reduces firms’ demand for labour, so unemployment may increase. The effect is stronger if firms cannot pass on higher costs without cutting production.
-
The current account effect is mixed. If the UK imports more expensive energy, the import bill may rise, but weaker domestic demand may reduce imports of other goods.
-
Evaluation depends on duration. A temporary oil spike may have limited long-run impact, but a persistent shock can feed into wages, expectations and interest-rate decisions.
Evaluation: what determines the final impact?
The same shift can have different effects depending on the economy’s starting point.
If the economy begins with a negative output gap, a rise in AD is more likely to increase real GDP and reduce unemployment with limited inflation. There is spare capacity, so firms can expand output without bidding up wages and input prices too much.
If the economy is already close to full capacity, a rise in AD is more likely to cause inflation. Output cannot expand much beyond potential in a sustainable way, so demand-pull inflation becomes the main effect.
The shape of AS also matters. A steep SRAS curve means AD increases mostly raise prices. A flatter SRAS curve means AD increases mostly raise output. This is why Keynesian economists argue that demand management can be effective in a recession, while neo-classical economists are more cautious about inflationary effects.
Policy response matters too. The Bank of England may raise interest rates to reduce AD if inflation is above target, but this can reduce investment, consumption and growth. Fiscal expansion can support demand, but may increase government borrowing. Supply-side policies can shift LRAS right, but they often take years to work.
Best judgement
A rightward shift in LRAS is usually the most sustainable route to higher growth because it can raise real GDP without the same inflationary pressure. However, in a recession with spare capacity, a short-run boost to AD may still be justified.
In the exam
-
Start by identifying whether the shock affects AD, SRAS or LRAS, then explain the direction of the shift.
-
Analyse at least two macro indicators, such as real GDP and inflation, before adding unemployment or the current account.
-
Evaluate using the starting output gap, the time period, the size of the shock and likely policy responses.
Check yourself
- Why might an increase in AD cause more inflation in one economy than another?
- How does an adverse SRAS shock create a policy trade-off?
- What is the difference between short-run equilibrium and long-run equilibrium?
