What you'll learn
- What the short run Phillips curve shows about inflation and unemployment.
- Why a short-run trade-off may exist when aggregate demand changes.
- How to draw and analyse the Phillips curve diagram.
- Why the relationship is useful, but not always reliable, in real economies like the UK.
The two variables: inflation and unemployment
Before the Phillips curve makes sense, you need two core macroeconomic indicators.
Inflation and unemployment
Inflation is a sustained rise in the general price level, usually measured in the UK by the Consumer Prices Index, with the Bank of England targeting 2% CPI inflation.
Unemployment is the percentage of the labour force who are without work, available for work, and actively seeking work.
A government often wants low inflation and low unemployment at the same time. The short run Phillips curve suggests there may be a conflict between these two objectives.
The short run
Short run
The short run is a period in which some prices, wages, expectations, or contracts do not fully adjust to changes in the economy.
This matters because if wages and expectations are slow to adjust, higher demand can temporarily increase output and employment before inflationary pressure fully feeds through.
Why might inflation and unemployment be linked?
The key idea is that when aggregate demand rises, firms sell more output. To produce more, they may hire more workers. This reduces unemployment.
Aggregate demand
Aggregate demand is the total planned spending on goods and services in an economy at a given price level. It includes consumption, investment, government spending, and net exports.
As unemployment falls, the labour market becomes tighter. Firms may have to offer higher wages to attract or keep workers. Higher wages can increase firms’ costs, and strong demand may also allow firms to raise prices more easily.
This creates demand-pull inflation, where rising total demand pushes up the general price level.
The basic trade-off
In the short run, lower unemployment may be achieved at the cost of higher inflation, while lower inflation may require accepting higher unemployment.
Analysing a demand boom
Suppose the UK economy experiences a rise in consumer confidence and investment.
- Higher confidence increases consumption and investment, so aggregate demand rises.
- Firms receive more orders and increase output, so they need more labour.
- Unemployment falls as firms recruit additional workers.
- A tighter labour market puts upward pressure on wages, while strong demand makes price rises easier.
- The result is lower unemployment but higher inflation, showing the short-run trade-off.
What is the short run Phillips curve?
Short run Phillips curve
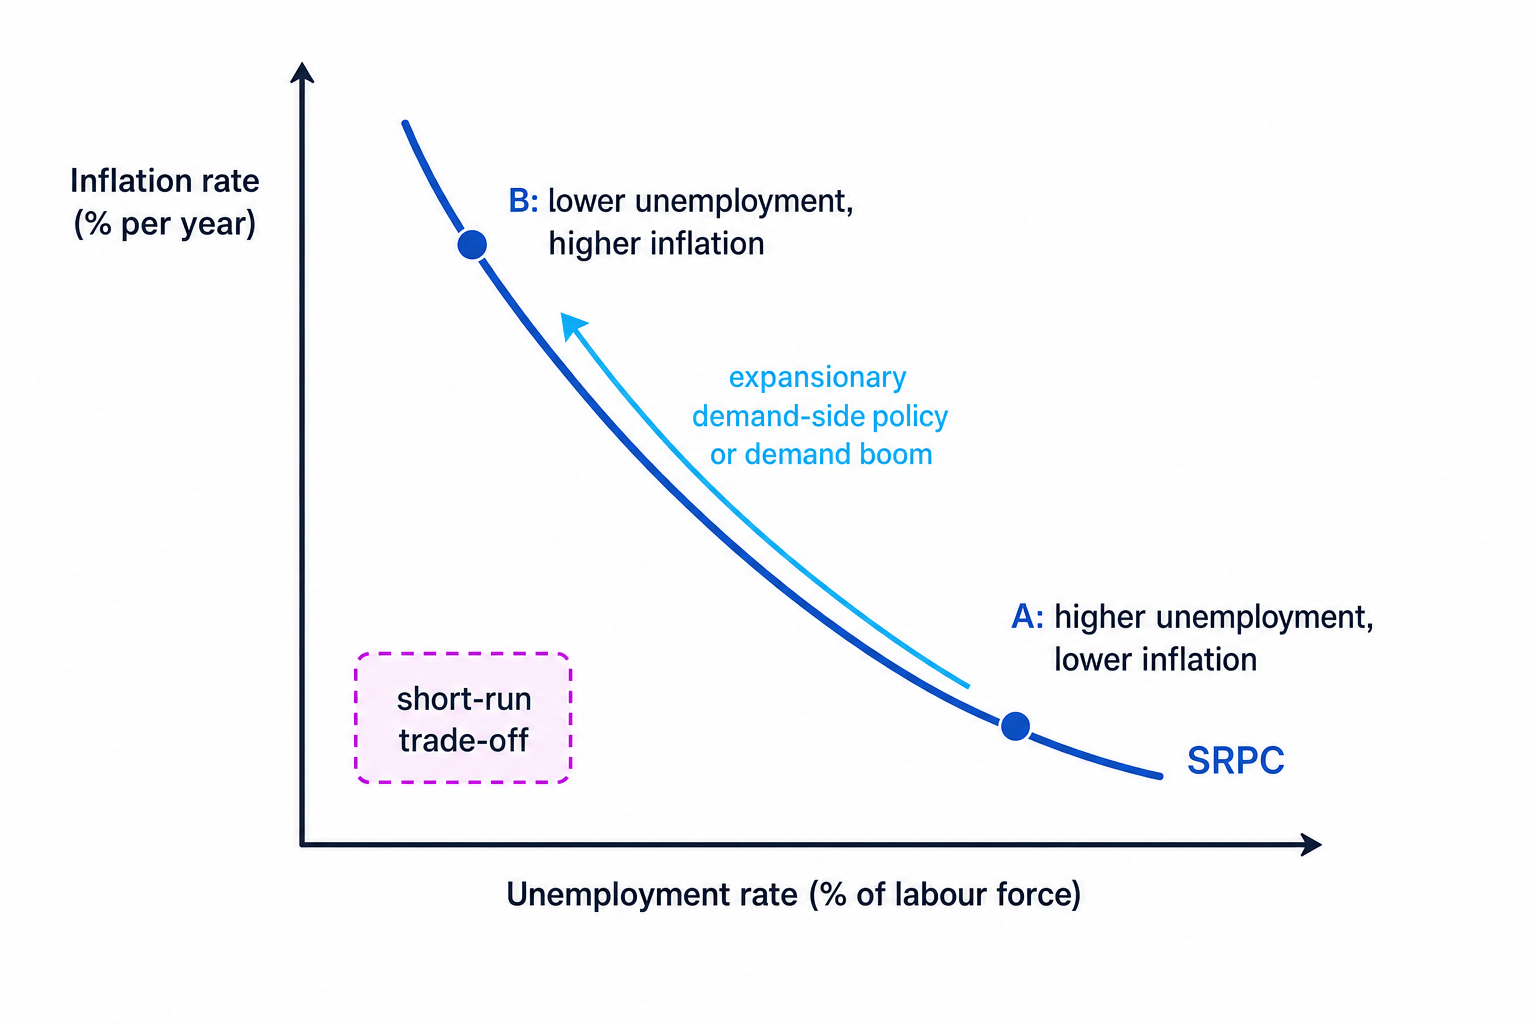
The short run Phillips curve shows an inverse relationship between the unemployment rate and the inflation rate in the short run.
It is named after economist A. W. Phillips, who found a historical relationship in UK data between unemployment and wage inflation. Later economists adapted the idea to show a relationship between unemployment and price inflation.
On the diagram:
- The vertical axis shows the inflation rate.
- The horizontal axis shows the unemployment rate.
- The curve slopes downwards.
- Moving up and left means lower unemployment but higher inflation.
- Moving down and right means lower inflation but higher unemployment.
Movement along the short run Phillips curve
A movement along the curve is usually caused by a change in aggregate demand.
Expansionary demand-side policy
Expansionary demand-side policy means policy designed to increase aggregate demand. This could include:
- Lower interest rates by the Bank of England.
- Higher government spending.
- Lower taxation.
These policies can increase spending, output, and employment. But if the economy is close to full capacity, they may also increase inflation.
Moving along the Phillips curve
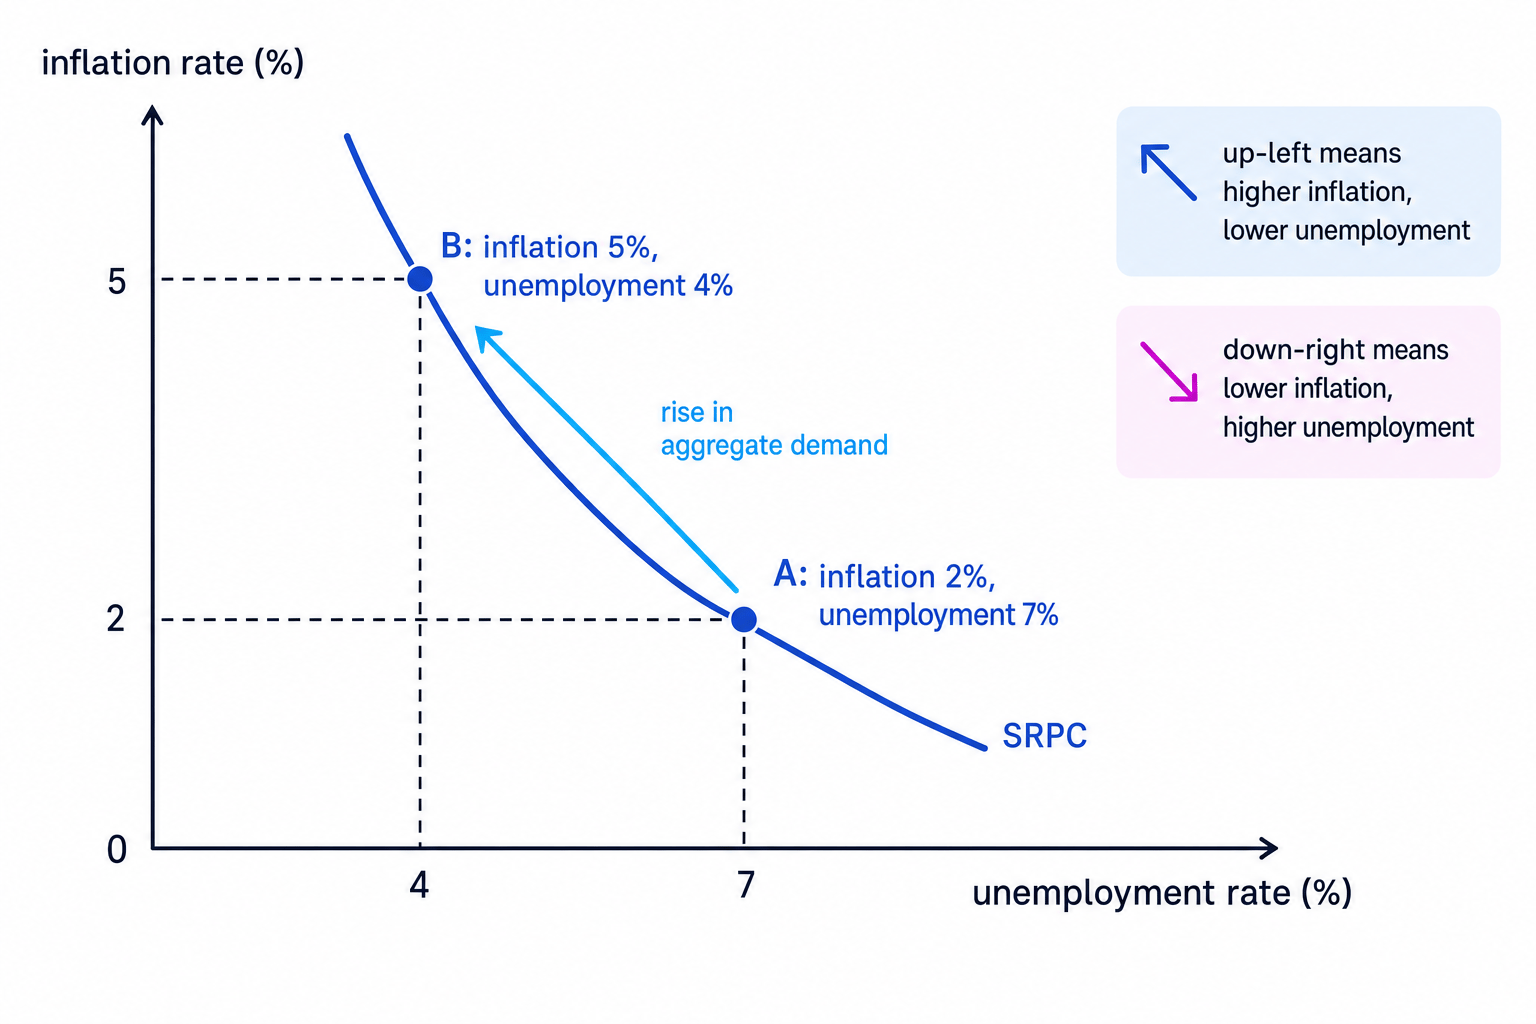
Suppose the economy starts at point A, with unemployment at 7% and inflation at 2%. The government then increases spending to boost demand.
- Higher government spending raises aggregate demand, so firms increase production.
- Firms hire more workers, reducing unemployment from 7% to 4%.
- Because labour is now scarcer, wage pressure rises and firms face higher costs.
- Inflation rises from 2% to 5%.
- On the diagram, the economy moves up and left along the short run Phillips curve: unemployment is lower, but inflation is higher.
Contractionary demand-side policy
Contractionary demand-side policy means policy designed to reduce aggregate demand. For example, the Bank of England may raise interest rates to reduce borrowing and spending.
This can reduce inflationary pressure, but it may also reduce output and increase unemployment.
Direction check
On a short run Phillips curve, left means lower unemployment and up means higher inflation. So a demand boom moves the economy up-left, while a demand slowdown moves it down-right.
UK evidence and application
The Phillips curve was originally based on UK evidence. Phillips observed that when UK unemployment was low, wage inflation tended to be higher, and when unemployment was high, wage inflation tended to be lower.
A useful UK application is the late 1980s boom, sometimes called the Lawson boom. Strong demand helped reduce unemployment, but inflationary pressure increased, and inflation rose sharply by the end of the decade.
More recently, the relationship has been less stable. For example, after the global financial crisis, unemployment fell without inflation rising dramatically for several years. During 2021–2023, UK inflation rose sharply partly because of energy prices, supply-chain disruption, and the cost-of-living squeeze, not simply because unemployment was very low.
This is important for evaluation: the short run Phillips curve is useful, but real-world inflation can come from both demand-side and supply-side causes.
Movements versus shifts
Do not confuse a movement along the short run Phillips curve with a shift of the curve.
A movement along the curve happens when aggregate demand changes.
A shift of the curve happens when the relationship between inflation and unemployment changes.
Inflation expectations
Inflation expectations are what households, workers, firms, and financial markets expect inflation to be in the future.
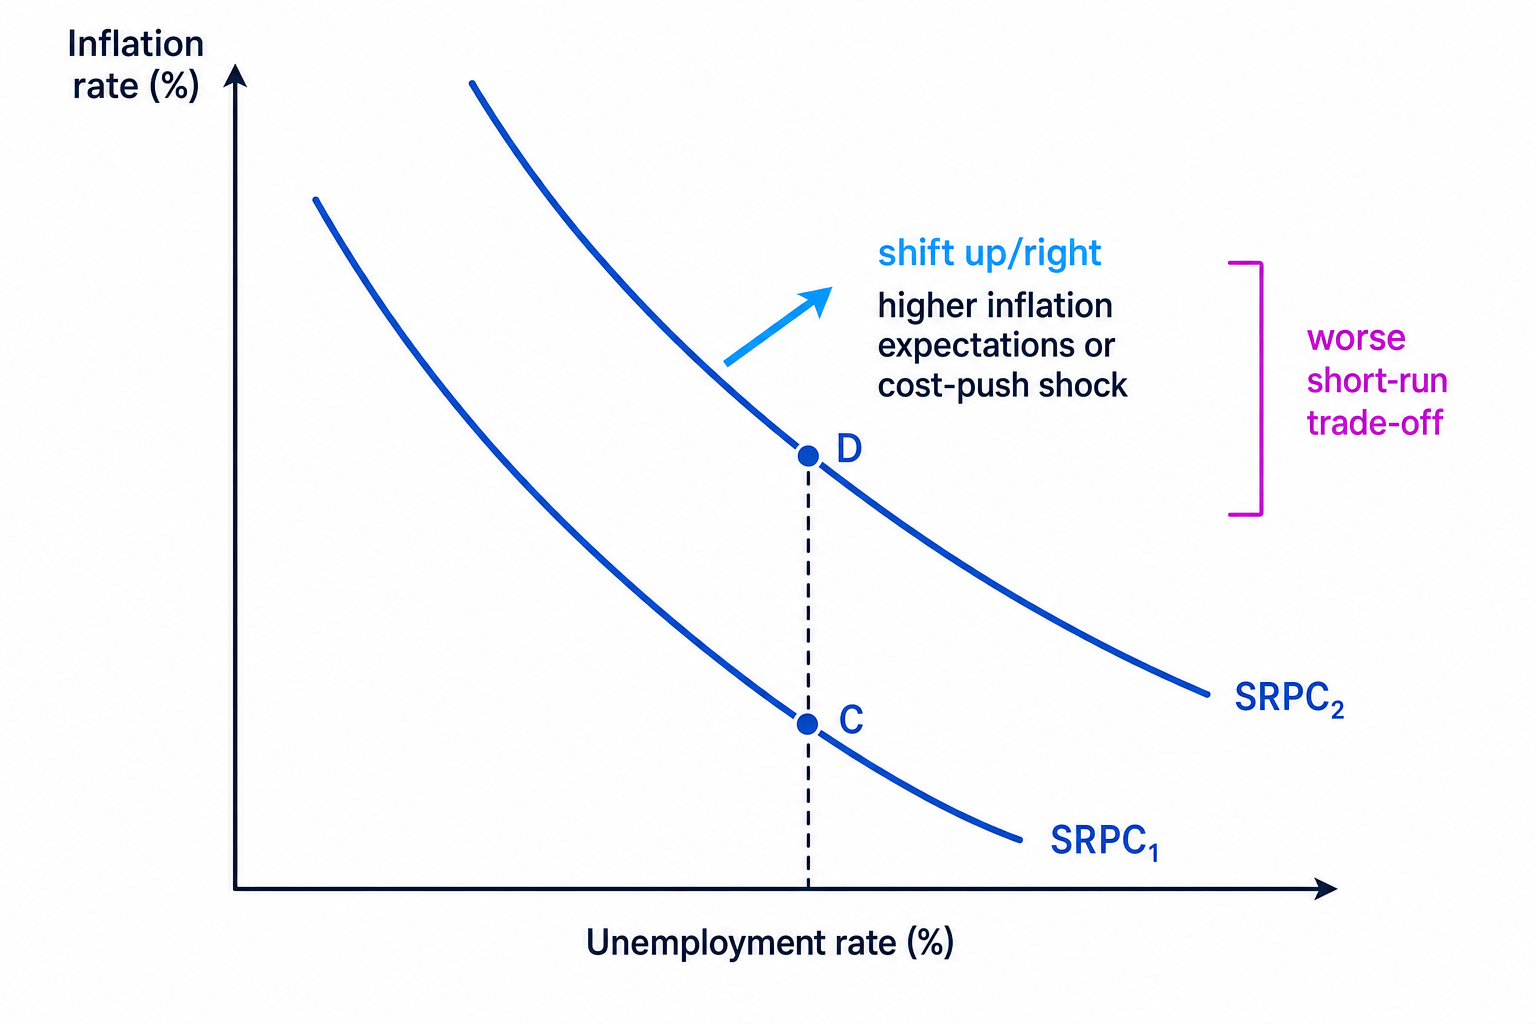
If workers expect higher inflation, they may demand higher wages to protect their real incomes. Firms may then raise prices to cover higher costs. This can shift the short run Phillips curve upwards.
A cost-push shock can also shift the curve upwards. This happens when firms’ costs rise independently of domestic demand, such as from higher oil, gas, food, or import prices.
A worse trade-off
If the short run Phillips curve shifts upwards, the economy faces higher inflation at each unemployment rate. This means the trade-off has worsened.
Identifying a shift of the Phillips curve
Suppose unemployment stays at 5%, but inflation rises from 3% to 8% after a sharp rise in global energy prices.
- Unemployment has not fallen, so this is not simply a move up-left along the curve.
- The rise in energy prices increases firms’ costs, creating cost-push inflation.
- At the same unemployment rate, inflation is now higher.
- The short run Phillips curve has shifted upwards, showing a worse inflation-unemployment trade-off.
Why the trade-off may break down
The short run Phillips curve is not a fixed mechanical rule. It is a model, and models simplify reality.
Expectations can adjust
Economists Milton Friedman and Edmund Phelps argued that if people expect higher inflation, the short-run trade-off may disappear over time. Workers build expected inflation into wage demands, and firms build it into price-setting.
This means attempts to keep unemployment very low using demand-side stimulus may eventually lead mainly to higher inflation, not permanently lower unemployment.
Supply shocks matter
Inflation can rise even when unemployment is high. This is called stagflation: high inflation combined with weak growth or high unemployment. The 1970s oil shocks are a classic example.
Spare capacity matters
If the economy has lots of spare capacity, higher aggregate demand may reduce unemployment without much inflation. If the economy is already near full capacity, extra demand is more likely to raise prices.
Assuming the curve always works perfectly
The short run Phillips curve suggests a possible trade-off, not a guaranteed one. In evaluation, always ask whether inflation is being caused by demand, costs, expectations, or external shocks.
How to write Phillips curve analysis
A strong paragraph should link the diagram to a clear chain of reasoning.
For example:
Expansionary fiscal policy increases aggregate demand. Firms respond by increasing output and hiring more workers, reducing unemployment. As the labour market tightens, wage pressure increases and firms may raise prices. Therefore, the economy moves up-left along the short run Phillips curve, showing lower unemployment but higher inflation in the short run.
To evaluate, add a limiting condition:
However, if inflation is caused mainly by imported energy prices or supply-chain disruption, unemployment may not fall. Instead, the short run Phillips curve may shift upwards, creating higher inflation at the same level of unemployment.
In the exam
- Draw the diagram with inflation rate (%) on the vertical axis and unemployment rate (%) on the horizontal axis.
- Use arrows carefully: demand-side changes cause a movement along the SRPC; expectations or supply shocks can cause a shift.
- Add evaluation by asking whether the inflation is demand-pull, cost-push, or expectations-driven, and whether the relationship is likely to hold in the short run only.
Check yourself
- Why does a rise in aggregate demand tend to reduce unemployment in the short run?
- On a Phillips curve diagram, what does a movement up-left show?
- Why might a rise in global oil prices shift the short run Phillips curve upwards?