

What you'll learn
- Why the short-run Phillips curve may show a temporary trade-off between inflation and unemployment.
- How inflationary expectations make that short-run trade-off unstable.
- Why the long-run Phillips curve is vertical at the natural rate of unemployment / NAIRU.
- How supply-side changes and policy can shift the long-run Phillips curve.
The starting point: inflation, unemployment and the Phillips curve
Inflation is a sustained increase in the general price level, usually measured in the UK using the Consumer Prices Index (CPI), with the Bank of England targeting 2% inflation.
Unemployment is the number of people who are willing and able to work at the current wage rate but cannot find a job.
The Phillips curve, named after A. W. Phillips, shows a relationship between inflation and unemployment. The original idea was that when unemployment is low, inflation tends to be high; when unemployment is high, inflation tends to be low.
Phillips curve
The Phillips curve is a macroeconomic model showing the relationship between the inflation rate and the unemployment rate.
The key issue in this topic is whether that relationship is stable. Neo-Classical economists argue that in the long run it is not: the economy cannot permanently “buy” lower unemployment simply by accepting higher inflation.
The short-run Phillips curve
The short run is a period in which some wages, prices and expectations have not fully adjusted. In the short run, the Phillips curve is usually drawn as downward-sloping.
Short-run Phillips curve (SRPC)
The short-run Phillips curve shows an inverse relationship between inflation and unemployment, assuming inflationary expectations and supply-side conditions are unchanged.
Why might it slope downwards?
If aggregate demand rises, firms sell more output and need more workers. Unemployment falls. But as labour becomes scarcer, firms may have to offer higher wages. Stronger demand and higher wage costs can then push prices up, causing inflation.
So the SRPC suggests a short-run trade-off: lower unemployment may come with higher inflation.
Reading a short-run Phillips curve
Suppose the Bank of England cuts interest rates, increasing consumer spending and investment. Unemployment falls from 6% to 4.5%, while inflation rises from 2% to 4%.
-
The fall in unemployment suggests the economy has moved closer to full capacity, so firms are hiring more workers.
-
The rise in inflation suggests stronger demand and wage pressure are pushing up prices.
-
Because inflationary expectations have not yet changed in this simple short-run story, this is shown as a movement along the existing SRPC, not a shift of the curve.
Seeing the SRPC as a permanent menu
Do not write that governments can simply choose any combination of inflation and unemployment forever. The short-run trade-off depends on expectations being unchanged — and expectations can adjust.
Inflationary expectations: why the SRPC is unstable
Inflationary expectations are what households, workers, firms and financial markets expect inflation to be in the future.
Inflationary expectations
Inflationary expectations are beliefs about the future rate of inflation, which affect wage demands, price-setting and spending decisions today.
This matters because workers care about their real wage, meaning their wage adjusted for inflation. If workers expect prices to rise, they may demand higher nominal wages, meaning higher cash wages, to protect their living standards.
Neo-Classical economists, especially Milton Friedman and Edmund Phelps, argued that the short-run Phillips curve is not stable because expectations adjust. If inflation rises above what people expected, unemployment may temporarily fall. But once workers and firms update their expectations, the SRPC shifts upwards.
A compact way to show this idea is:
π=πe−α(u−uN)+s\pi = \pi^e - \alpha(u-u_N) + sπ=πe−α(u−uN)+sHere, π\piπ is actual inflation, πe\pi^eπe is expected inflation, uuu is actual unemployment, uNu_NuN is the natural rate of unemployment or NAIRU, α\alphaα shows how strongly inflation responds to unemployment gaps, and sss represents a supply shock.
This equation is not usually needed as a memorised formula, but it helps you see the logic:
- If u<uNu<u_Nu<uN, unemployment is below its sustainable rate, so inflation tends to rise above expected inflation.
- If πe\pi^eπe rises, the whole SRPC shifts upwards.
- If there is an adverse supply shock, such as a jump in energy prices, inflation can rise even without unemployment falling.
Expectations shift the SRPC
Higher expected inflation means workers demand higher wage increases and firms raise prices more quickly, so the short-run Phillips curve shifts upwards.
The long-run Phillips curve and the NAIRU
The long run is a period in which wages, prices and expectations have fully adjusted.
NAIRU / natural rate of unemployment
The NAIRU is the non-accelerating inflation rate of unemployment: the unemployment rate at which inflation is stable. It is linked to frictional and structural unemployment, rather than cyclical unemployment.
Frictional unemployment is short-term unemployment caused by people moving between jobs. Structural unemployment is caused by a mismatch between workers’ skills or locations and the jobs available.
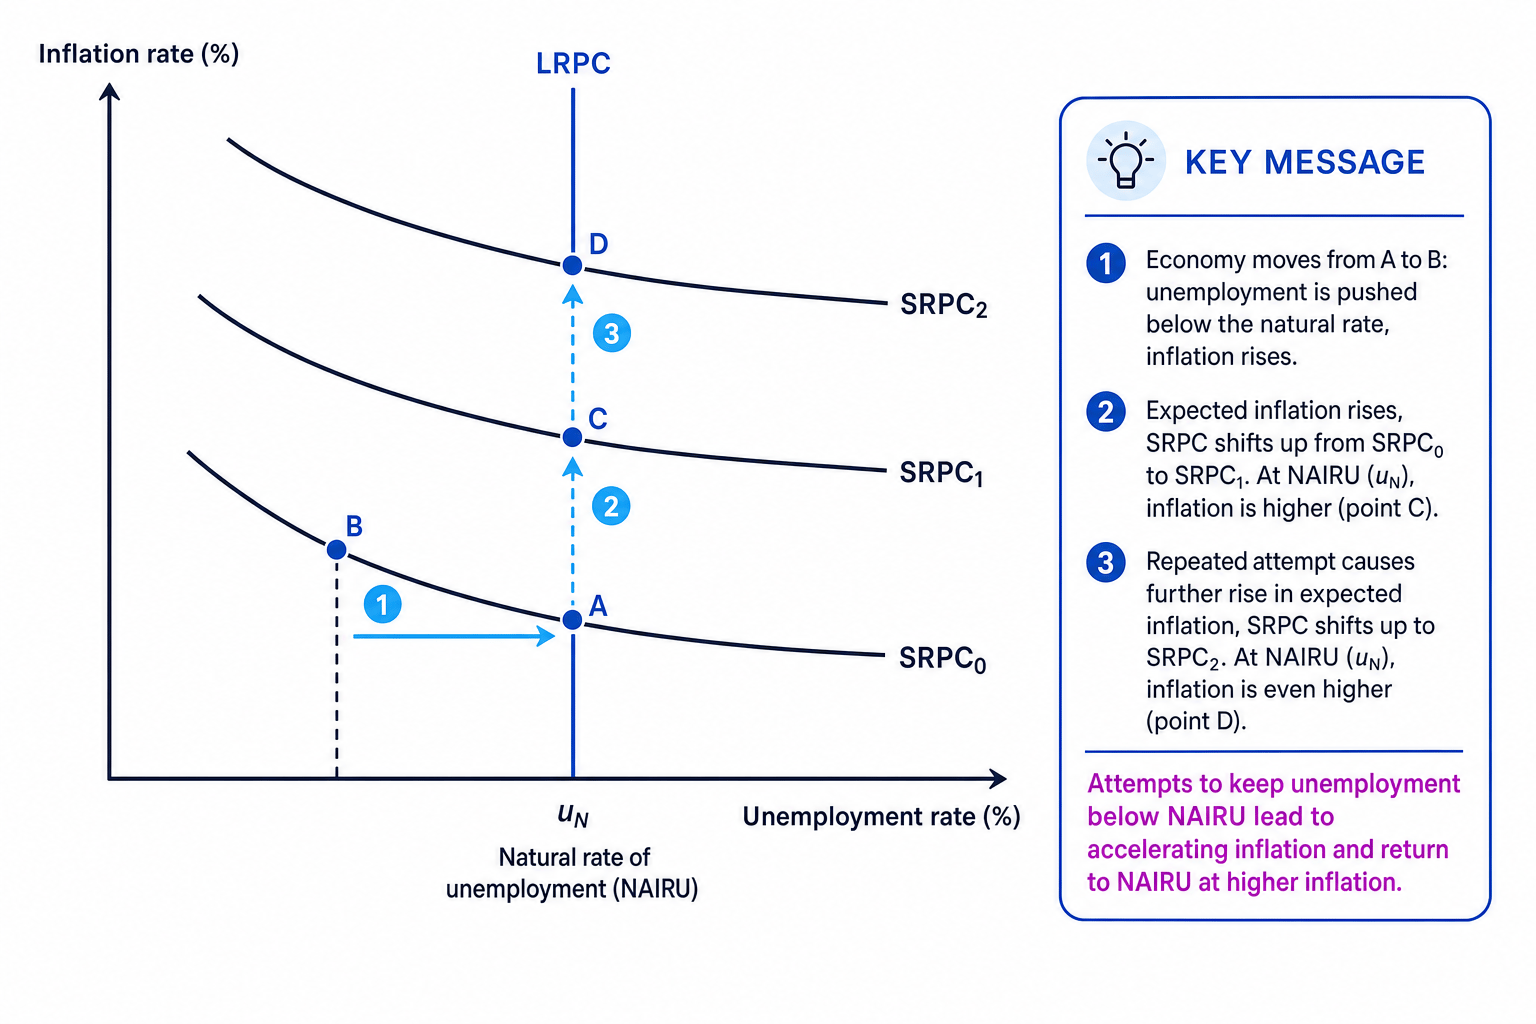
The long-run Phillips curve (LRPC) is vertical at the NAIRU. This means that, in the long run, there is no trade-off between inflation and unemployment. The economy returns to its natural rate of unemployment, but possibly with a higher inflation rate.
The diagram below illustrates the Neo-Classical argument: policymakers can push unemployment below the NAIRU in the short run, but rising expected inflation shifts the SRPC upwards, so the economy returns to the NAIRU with higher inflation.
Tracing expectations through the Phillips curve
Suppose the NAIRU is 5%, expected inflation is 2%, and the government tries to push unemployment down to 4% using expansionary fiscal policy.
-
At the start, unemployment is 5% and inflation is 2%, so actual inflation matches expected inflation and the economy is at the NAIRU.
-
Higher government spending increases aggregate demand, so firms hire more workers. Unemployment falls to 4%, but inflation rises to 4% because demand and wage pressures increase.
-
Workers and firms revise their expectations. If they now expect 4% inflation, workers demand higher wage increases and firms set higher prices, shifting the SRPC upwards.
-
As real wages adjust, firms no longer want to employ as many extra workers. Unemployment returns to 5%, but inflation remains higher at 4%.
-
If the government again tries to force unemployment down to 4%, inflation may have to rise to 6% or more to surprise workers again. This is why unemployment below the NAIRU causes accelerating inflation.
Why “accelerating” inflation?
Accelerating inflation means the inflation rate keeps rising: for example, from 2% to 4% to 6%.
The reason is that each attempt to keep unemployment below the NAIRU works only while actual inflation is higher than expected inflation. Once expectations catch up, the temporary employment gain disappears.
So, in the Neo-Classical model, the economy eventually returns to the NAIRU — but at a higher rate of inflation than before.
The long-run result
Attempts to keep unemployment below the NAIRU do not permanently reduce unemployment. They lead to higher and potentially accelerating inflation, while unemployment returns to its natural rate.
Shifts in the long-run Phillips curve
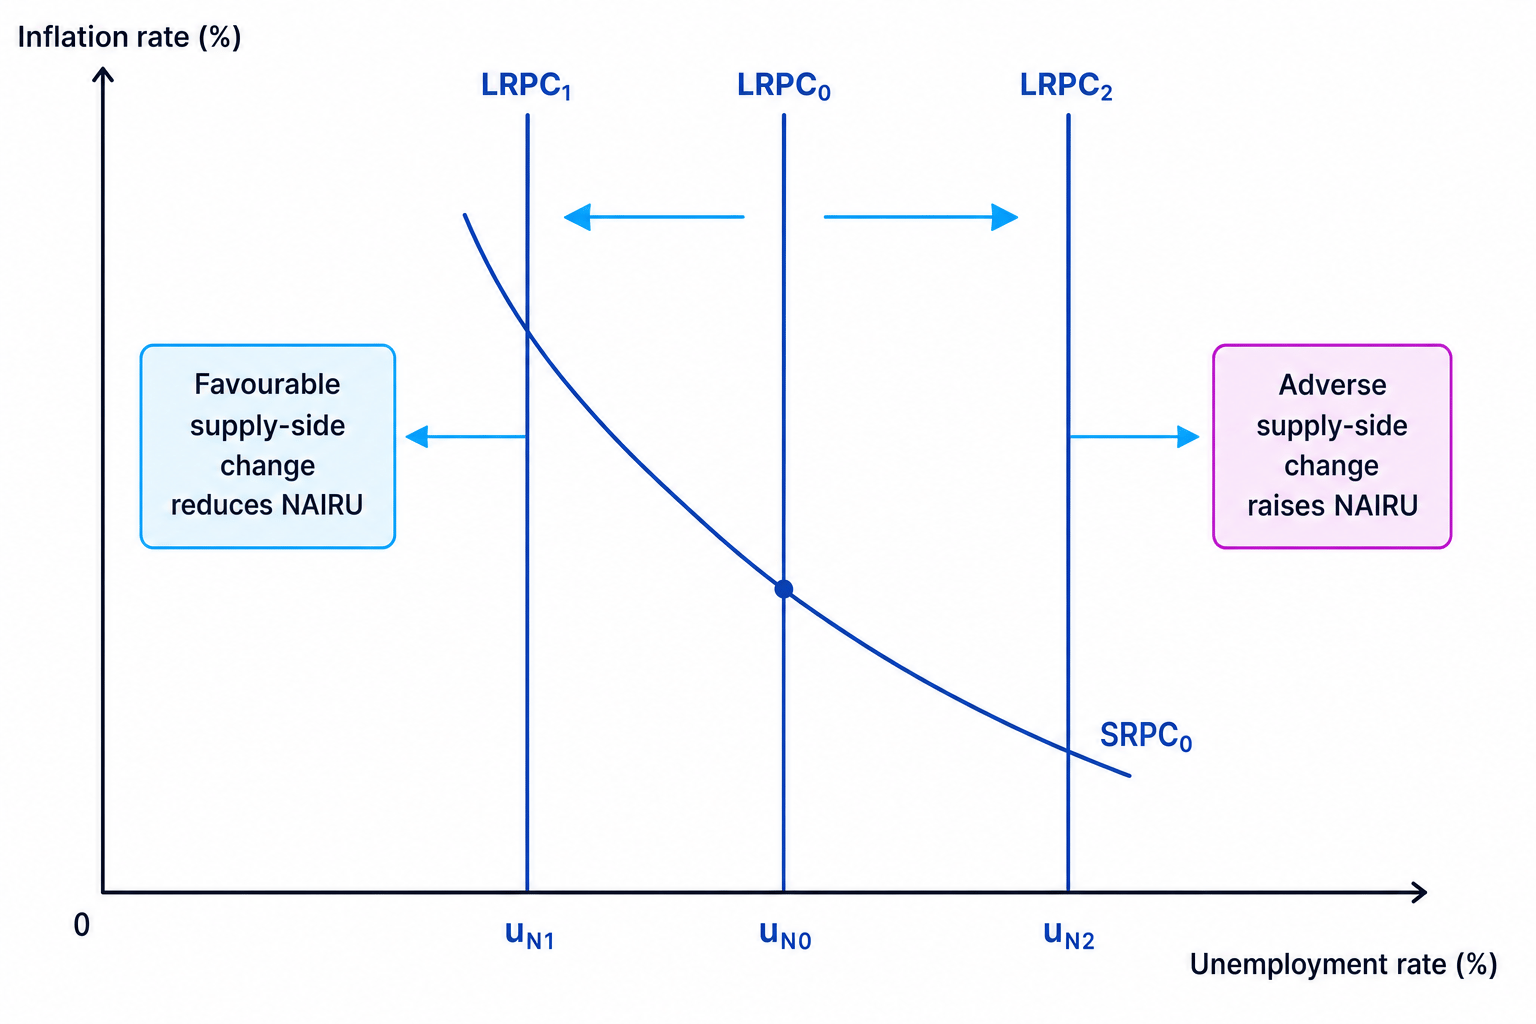
The position of the LRPC depends on the supply side of the economy. A supply-side change affects productive capacity, efficiency, labour-market flexibility or the matching of workers to jobs.
If the NAIRU falls, the LRPC shifts left. If the NAIRU rises, the LRPC shifts right.
The diagram below shows how favourable and adverse supply-side changes affect the position of the long-run Phillips curve.
Favourable supply-side changes: LRPC shifts left
A leftward shift means the economy can sustain a lower unemployment rate without accelerating inflation.
Examples include:
- Better education, training and apprenticeships reducing skills mismatches.
- Improved job search information reducing frictional unemployment.
- Better transport, childcare or housing mobility helping workers access jobs.
- Higher productivity from investment, infrastructure and innovation.
- Well-designed tax and benefit reforms increasing incentives to work.
Adverse supply-side changes: LRPC shifts right
A rightward shift means the NAIRU has increased, so inflation may accelerate at a higher unemployment rate than before.
Examples include:
- Persistent skill shortages or regional mismatches.
- Long-term unemployment causing workers’ skills to deteriorate, known as hysteresis.
- Lower labour-force participation due to ill-health or early retirement.
- Brexit-related frictions reducing labour mobility or increasing trade costs.
- Persistent energy or supply-chain shocks damaging firms’ capacity.
Analysing a leftward shift in the NAIRU
Suppose a government-funded retraining programme reduces the NAIRU from 6% to 5%.
-
The policy tackles structural unemployment by helping workers gain skills that match available vacancies.
-
Because the sustainable unemployment rate has fallen, the LRPC shifts left from 6% to 5%.
-
If unemployment falls to 5%, inflation need not accelerate, because the economy is now at its new NAIRU rather than below it.
-
However, the judgement depends on the quality of training, time lags, whether jobs exist in the right regions, and whether workers can move to where vacancies are.
Policy implications
Neo-Classical economists argue that governments should not rely on expansionary demand-side policy to hold unemployment below the NAIRU. In their view, that mainly creates higher inflation in the long run.
Instead, policy should focus on:
- Credible anti-inflation policy, such as the Bank of England maintaining confidence in its 2% inflation target.
- Supply-side policies that reduce the NAIRU and shift the LRPC left.
- Avoiding repeated surprise inflation, because once expectations rise, reducing inflation may require higher unemployment in the short run.
UK context is useful here. During the 2021–23 cost-of-living squeeze, inflation rose sharply due to energy prices, supply-chain problems and strong post-pandemic demand. The Bank of England raised interest rates partly to reduce demand, but also to prevent high inflation becoming embedded in wage and price expectations.
Diagram checklist
For a standard long-run Phillips curve answer, label the axes, draw the SRPC downward-sloping, draw the LRPC vertical at the NAIRU, show a movement along the SRPC, then show the SRPC shifting upwards as expectations rise.
Evaluation: how far should we accept the model?
The long-run Phillips curve is powerful, but it should not be used mechanically.
First, the NAIRU is hard to measure. Economists may disagree about whether unemployment is below, at or above its sustainable level.
Second, Keynesian economists argue that when there is spare capacity, expansionary fiscal or monetary policy can reduce cyclical unemployment without much inflationary pressure, at least until the economy approaches full capacity.
Third, supply shocks can complicate the picture. Inflation may rise even when unemployment is not low, as seen during global energy-price shocks. This can make it harder to judge whether inflation is demand-pull, cost-push or expectations-driven.
Finally, supply-side policies can shift the LRPC left, but they often involve long time lags and uncertain outcomes. Training, infrastructure and childcare support may be effective, but they require funding and careful implementation.
In the exam
-
Define the SRPC, LRPC, NAIRU and inflationary expectations before analysing the diagram.
-
Show the full Neo-Classical chain: demand stimulus lowers unemployment below the NAIRU, inflation rises, expectations adjust, the SRPC shifts up, and unemployment returns to the NAIRU at higher inflation.
-
Evaluate using time period, uncertainty over the NAIRU, supply-side shocks, policy credibility and whether supply-side reforms can shift the LRPC.
Check yourself
- Why does the SRPC shift upwards when inflationary expectations rise?
- Why is the LRPC vertical at the NAIRU in the Neo-Classical model?
- Give one policy that could shift the LRPC left and one factor that could shift it right.
