

What you'll learn
- How economists measure actual growth (rising real output) and potential growth (rising productive capacity).
- How output gaps connect to recessions and the business cycle.
- How to use a PPF (a diagram of maximum output combinations) and AD/AS (aggregate demand and aggregate supply) diagrams.
- How to evaluate the benefits and costs of growth for households, firms and governments.
The basic idea
Gross domestic product (GDP) is the total value of final goods and services produced within an economy over a period of time. Real GDP is GDP adjusted for inflation, so it measures changes in the volume of output rather than just changes in prices.
Economic growth
Economic growth is an increase in real GDP over time. More deeply, economists often use the term to mean an increase in the economy’s productive capacity: the maximum sustainable output the economy can produce using its resources and technology.
This distinction matters. An economy can grow in the short run because demand rises and firms use spare capacity. But long-run growth depends on whether the economy can actually produce more — for example through better technology, more capital, or a more skilled workforce.
Actual growth and potential growth
Actual economic growth is a rise in measured real GDP. It is usually expressed as a percentage change over time, often year-on-year.
Potential economic growth is an increase in the economy’s productive capacity. It shows what the economy could produce if resources were fully and efficiently used.
The standard growth-rate formula is:
Real GDP growth rate=Real GDP this year−Real GDP last yearReal GDP last year×100\text{Real GDP growth rate} = \frac{\text{Real GDP this year} - \text{Real GDP last year}}{\text{Real GDP last year}} \times 100Real GDP growth rate=Real GDP last yearReal GDP this year−Real GDP last year×100Calculating growth and an output gap
Suppose UK real GDP was £2,300bn last year and £2,350bn this year. Economists estimate potential GDP this year is £2,400bn.
-
Calculate actual real GDP growth using last year as the base:
2,350−2,3002,300×100=2.17%\frac{2{,}350 - 2{,}300}{2{,}300} \times 100 = 2.17\%2,3002,350−2,300×100=2.17%, so real GDP grew by about 2.2% year-on-year. -
Compare actual real GDP with potential GDP:
2,350−2,4002,400×100=−2.08%\frac{2{,}350 - 2{,}400}{2{,}400} \times 100 = -2.08\%2,4002,350−2,400×100=−2.08%. -
Interpret the result: actual output is below potential output, so the economy has a negative output gap of about 2.1%, suggesting spare capacity and possible unemployment.
Output gaps and the business cycle
An output gap is the difference between actual real GDP and potential GDP.
A positive output gap occurs when actual output is above the economy’s estimated sustainable capacity. Firms may be stretching resources, overtime may rise, and inflationary pressure may build.
A negative output gap occurs when actual output is below potential output. There may be spare capacity, unemployment, and weak demand.
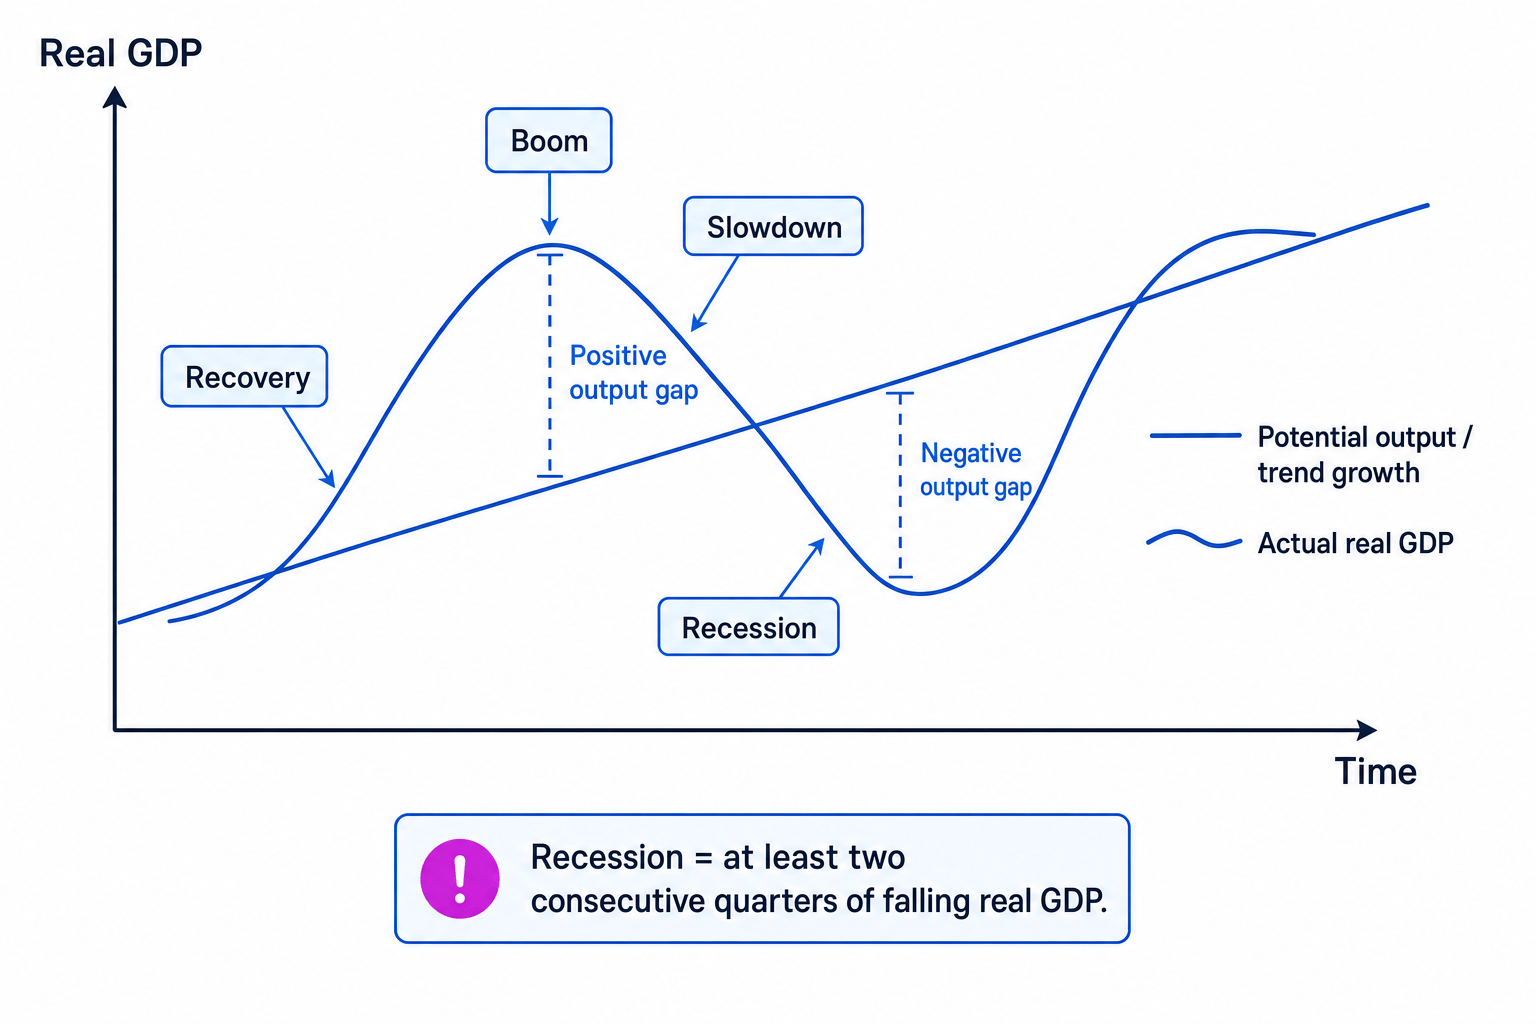
A business cycle is the pattern of fluctuations in actual real GDP around the long-run trend. The main phases are recovery, boom, slowdown and recession.
Recession
A recession is commonly defined as at least two consecutive quarters of falling real GDP. This is different from slow growth: if real GDP is still rising, the economy is not in recession.
The diagram shows actual real GDP moving around potential output, creating positive and negative output gaps.
Recession versus negative output gap
A recession means real GDP is falling. A negative output gap means actual output is below potential output. An economy can have a negative output gap even if GDP is slowly growing.
Showing growth with a PPF
A production possibility frontier (PPF) shows the maximum combinations of two types of goods an economy can produce when resources are fully and efficiently used.
A point inside the PPF shows under-used resources. Moving from inside the PPF towards the frontier shows actual growth because output rises using existing capacity. An outward shift of the PPF shows potential growth because the economy’s productive capacity has increased.
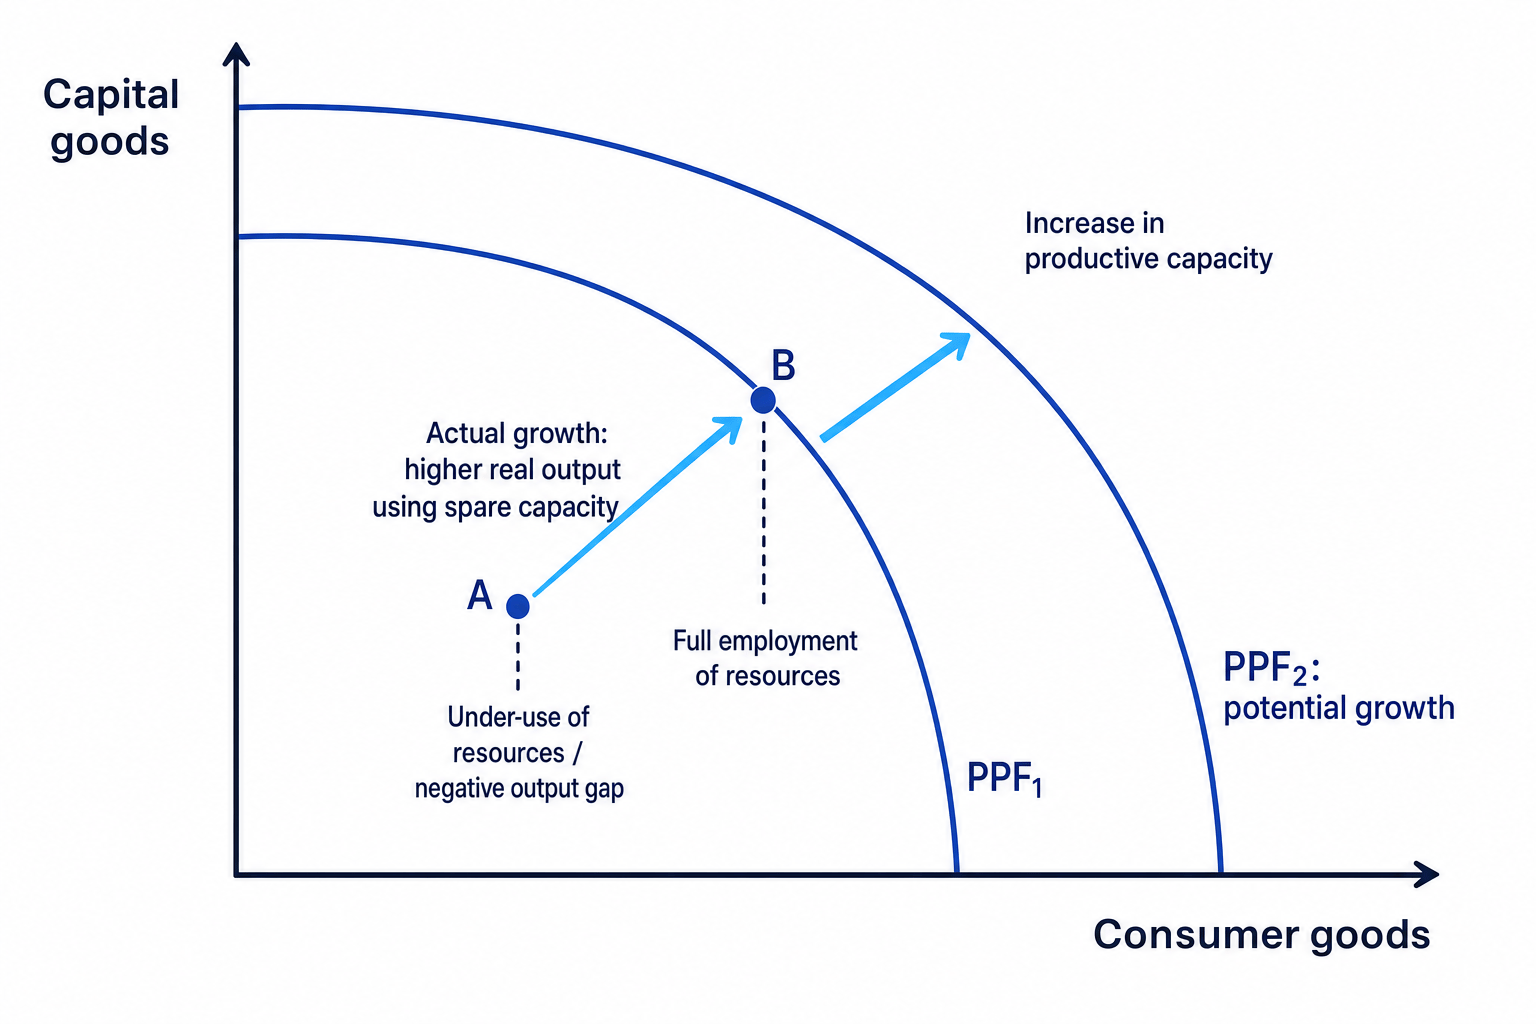
PPF distinction
A movement towards the PPF shows better use of existing resources. An outward shift of the PPF shows an increase in the economy’s capacity to produce.
Showing growth with AD/AS
Aggregate demand (AD) is total planned spending in the economy: consumption, investment, government spending and net exports. It can be written as:
AD=C+I+G+(X−M)AD = C + I + G + (X - M)AD=C+I+G+(X−M)Short-run aggregate supply (SRAS) is the total output firms are willing and able to supply at different price levels in the short run. Long-run aggregate supply (LRAS) shows the economy’s productive capacity.
In AD/AS analysis, a rise in AD can increase actual real GDP, especially when there is spare capacity. A rise in LRAS shows potential growth.
The diagram shows negative, zero and positive output gaps using AD/AS.
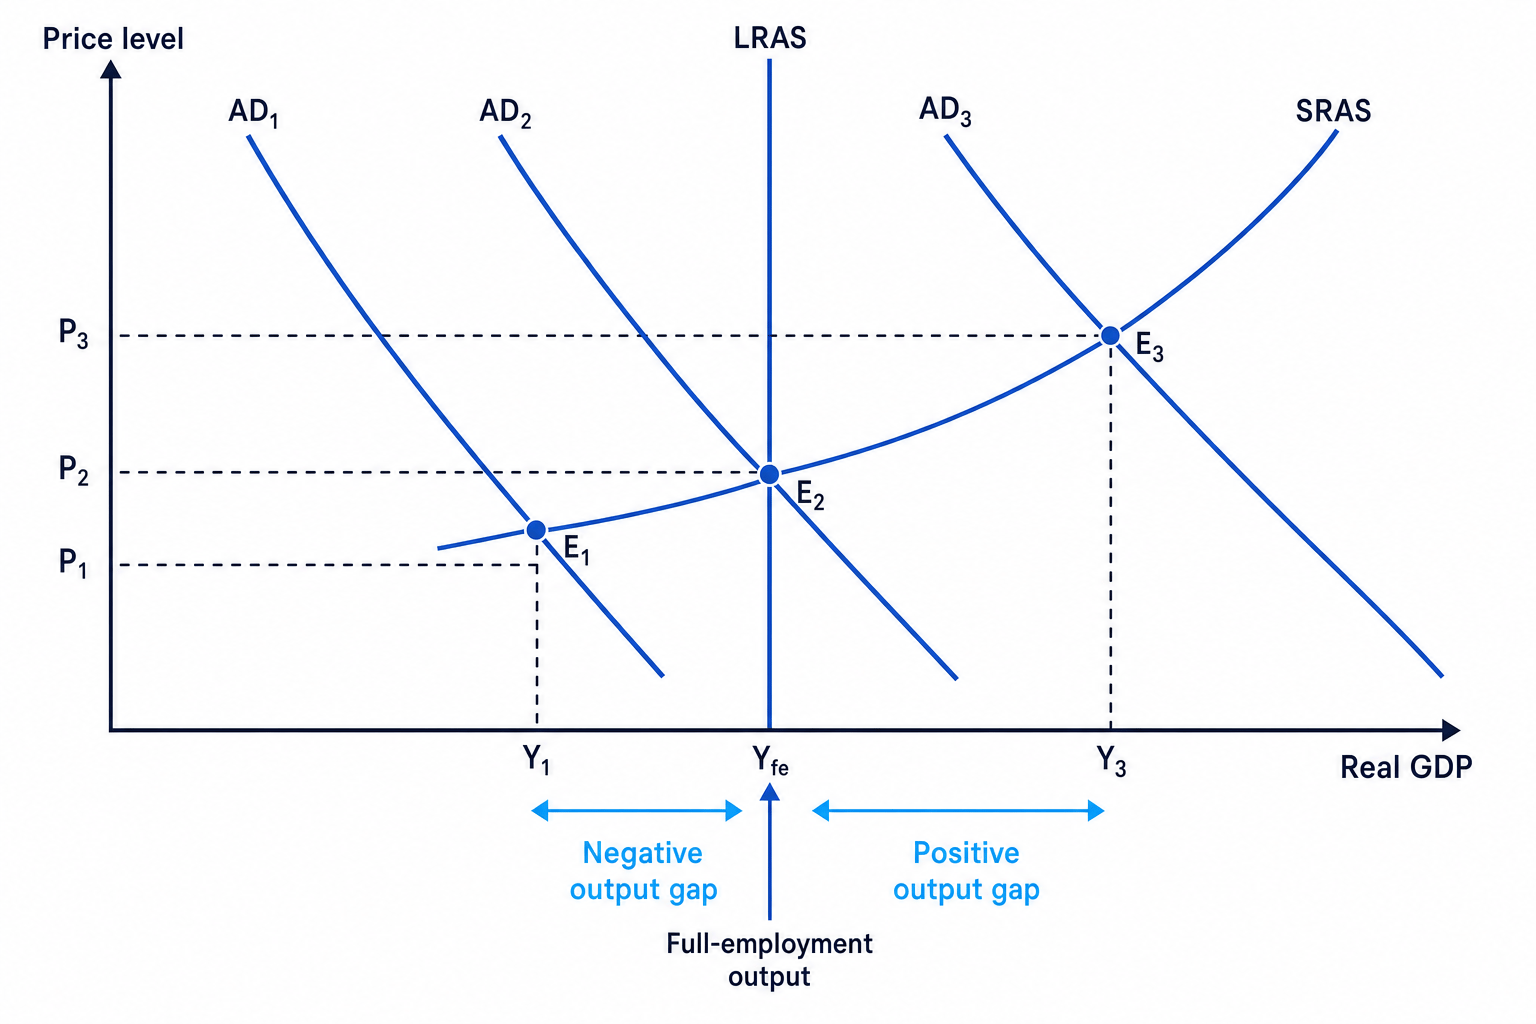
If AD increases when the economy has spare capacity, real GDP may rise with limited inflation. But if AD rises when the economy is already near full employment, the result may be mainly higher prices rather than sustainable growth.
Choosing the right diagram
If the question is about using spare capacity, show actual growth with AD shifting right or a movement towards the PPF. If the question is about productive capacity, show LRAS or the PPF shifting outwards.
Causes of economic growth
Growth can come from changes in the quantity, quality or efficiency of the factors of production: land, labour, capital and enterprise.
More factors of production
An economy can grow if it has more resources. For example, a larger labour force, more machinery, better infrastructure or more business investment can raise output.
Policies that may help include investment tax incentives, infrastructure spending, and measures to increase labour-force participation, such as childcare support or pension-age reforms.
Better-quality factors of production
Growth can also come from improving the quality of resources. Human capital means the skills, knowledge and health of workers. Education, apprenticeships, training and healthcare can improve productivity.
Better capital equipment also matters. For example, firms investing in robotics, software or artificial intelligence may produce more output per worker.
More efficient use of resources
Productivity means output per unit of input, such as output per worker or per hour. If productivity rises, the economy can produce more from the same resources.
Efficiency may improve through competition, better management, improved transport links, digital infrastructure, or reduced regulation where regulation has become unnecessarily costly.
Technology and innovation
Technological progress is a major source of long-run growth. It allows firms to produce more output, better-quality output, or the same output at lower cost.
However, technology can also create disruption. Some workers may need retraining, and benefits may be unevenly distributed across regions and industries.
Factor market flexibility
A factor market is a market for resources such as labour or capital. Factor market flexibility means resources can move more easily to where they are most productive.
For example, workers may move between regions or occupations more easily if housing is affordable, training is accessible and information about jobs is clear.
Growth needs demand and capacity
Demand-side policies can raise actual growth when there is spare capacity. Long-run sustainable growth usually needs supply-side improvements that raise productivity and productive capacity.
Benefits of economic growth
For households, growth can mean higher incomes, more employment opportunities and rising living standards. If real GDP per capita rises, average output per person increases, which may support better consumption, housing and welfare.
For firms, growth can increase sales, profits and confidence. This may encourage investment, innovation and expansion into new markets.
For governments, growth can increase tax revenues and reduce welfare spending. This can improve the budget position and create more room for spending on healthcare, education and infrastructure.
Recent UK context is useful here. After the COVID-19 recession and the cost-of-living squeeze, stronger real growth would help households recover purchasing power and help the government manage debt pressures.
Costs and limits of economic growth
Growth is not automatically good for everyone. The key evaluation issue is whether it is inclusive, sustainable and non-inflationary.
Unequal distribution
Growth may raise average income while leaving some groups behind. For example, gains may be concentrated among high-skilled workers, asset owners, or already prosperous regions.
This is why real GDP per capita and income distribution matter. Higher GDP does not guarantee lower poverty.
Opportunity cost
Resources used to promote growth have alternative uses. Government spending on infrastructure may support future growth, but it could mean less money available for current healthcare, welfare or debt reduction.
Environmental sustainability
Growth may involve higher energy use, pollution, congestion and resource depletion. However, growth can also finance cleaner technology and renewable energy if policy encourages green investment.
Conflicts with other macroeconomic objectives
Fast AD-led growth can create demand-pull inflation if the economy is near capacity. It may also worsen the current account balance if consumers and firms buy more imports.
There can also be tension with low unemployment. A very tight labour market may raise wages and costs, adding inflationary pressure.
Assuming growth equals living standards
Real GDP growth is not the same as improved welfare. Check whether growth is per person, how evenly income is distributed, and whether there are environmental or social costs.
Overall judgement
The strongest evaluation is usually about the type of growth. Growth driven by productivity, investment and innovation is more likely to be sustainable. Growth driven mainly by short-run demand stimulus may be useful in a recession, but risky if the economy is already close to full capacity.
For essays, aim to distinguish short-run actual growth from long-run potential growth, then evaluate who gains, who loses, and whether the growth can continue without inflation or environmental damage.
In the exam
- Define whether you are discussing actual growth, potential growth, or both before drawing your diagram.
- Use the correct diagram: PPF or LRAS shifting out for potential growth; AD shifting right or movement towards the PPF for actual growth using spare capacity.
- Evaluate growth by considering distribution, sustainability, opportunity cost, and conflicts with inflation or the balance of payments.
Check yourself
- What is the difference between a recession and a negative output gap?
- How would you show potential growth on a PPF and on an AD/AS diagram?
- Why might economic growth fail to improve living standards for all households?
