

What you'll learn
- What a product market is and what consumers and firms are assumed to want.
- Why demand curves usually slope downwards and supply curves usually slope upwards.
- The main non-price factors that shift demand and supply.
- How to avoid the classic exam mistake: confusing a movement along a curve with a shift of the curve.
Product markets and economic agents
A market is any situation where buyers and sellers interact to exchange goods or services. It does not have to be a physical place: Amazon, the UK housing market and your local coffee shop are all markets.
Product market
A product market is a market where final goods and services are bought and sold, such as the market for smartphones, train tickets, coffee, clothing or streaming subscriptions.
An economic agent is a decision-maker in the economy. In this topic, the main agents are:
- Consumers: people or households buying goods and services.
- Firms: businesses producing and selling goods and services.
A-Level demand and supply analysis usually assumes agents behave rationally. This means they make decisions that best help them achieve their objectives, given the information they have.
Objectives of consumers and firms
Consumers: maximising utility
Utility means the satisfaction, benefit or wellbeing a consumer gets from consuming a good or service. Economists assume consumers aim to maximise utility: they choose the option that gives them the greatest satisfaction for the price they pay.
For example, if you have £10 for lunch, you compare the satisfaction from a meal deal, a takeaway, or saving the money. You are assumed to choose the option that gives you the highest utility.
Firms: maximising profit
Profit is the difference between a firm’s total revenue and total cost. In simple terms:
Profit is TR−TCTR - TCTR−TC, where TRTRTR is total revenue and TCTCTC is total cost.
Firms are usually assumed to maximise profit, meaning they try to choose output, prices and production methods that generate the largest possible profit.
Rational behaviour is a model assumption
The demand and supply model becomes clearer if we assume consumers seek maximum utility and firms seek maximum profit. In real life, people may be influenced by habits, advertising, poor information or social pressure, and firms may also pursue growth, survival or market share.
Demand: willingness and ability to buy
Demand is the quantity of a good or service that consumers are willing and able to buy at different prices over a period of time.
The phrase “willing and able” matters:
- You may be willing to buy a Ferrari, but if you cannot afford it, that is not effective demand.
- You may be able to buy a gym membership, but if you do not want one, there is no demand from you.
Quantity demanded means the amount consumers want to buy at one specific price. Demand means the whole relationship between price and quantity demanded.
Marginal utility and the demand curve
The word marginal means “additional” or “extra”.
Marginal utility
Marginal utility is the extra satisfaction gained from consuming one more unit of a good or service.
The key idea is diminishing marginal utility. This means that, as a consumer has more units of a good in a given time period, the extra satisfaction from each additional unit usually falls.
For example, the first slice of pizza may give you a lot of satisfaction. The fourth slice is still nice, but probably adds less extra satisfaction than the first.
This helps explain why demand curves normally slope downwards. Consumers are only likely to buy extra units if the price falls enough to make those lower-utility units worth buying.
Using marginal utility to explain demand
A student’s marginal utility from cups of coffee in one morning can be valued in money terms: first cup £5, second cup £4, third cup £3, fourth cup £2, fifth cup £1. They buy a cup if its marginal utility is at least as high as the price.
-
At a price of £4, the first cup gives £5 of utility and the second gives £4, so both are worth buying. The third cup gives only £3, so it is not worth buying. Quantity demanded is 2 cups.
-
At a price of £2, the first four cups give marginal utility of at least £2. The fifth cup gives only £1, so it is not worth buying. Quantity demanded is 4 cups.
-
When the price falls from £4 to £2, quantity demanded rises from 2 to 4 cups. This supports a downward-sloping demand curve: lower prices make extra, lower-utility units worth purchasing.
Why demand curves usually slope downwards
A demand curve shows the relationship between price and quantity demanded, assuming other factors are unchanged. Economists call this assumption ceteris paribus, meaning “all other things being equal”.
Demand curves normally slope downwards from left to right for three linked reasons.
1. Diminishing marginal utility
As explained above, extra units usually give less additional satisfaction. Consumers therefore need a lower price to justify buying more.
2. The substitution effect
The substitution effect is the change in demand caused by a good becoming cheaper or more expensive relative to alternatives.
If the price of Pepsi falls while Coca-Cola stays the same price, some consumers may switch from Coca-Cola to Pepsi. Pepsi has become relatively better value.
3. The income effect
The income effect is the change in demand caused by a price change affecting consumers’ real purchasing power.
If the price of a train ticket falls, your income can buy more than before. For most goods, this increases quantity demanded.
A normal good is a good whose demand rises when income rises. A inferior good is a good whose demand falls when income rises, often because consumers switch to higher-quality alternatives.
Supply: willingness and ability to sell
Supply is the quantity of a good or service that producers are willing and able to sell at different prices over a period of time.
Quantity supplied means the amount firms want to sell at one specific price. Supply means the whole relationship between price and quantity supplied.
In this basic supply curve analysis, firms are usually assumed to be price takers. A price taker is a firm that accepts the market price as given because it is too small to influence the price on its own.
Why supply curves usually slope upwards
A supply curve shows the relationship between price and quantity supplied, assuming other factors are unchanged.
Supply curves normally slope upwards from left to right for two main reasons.
1. Higher prices increase the profit incentive
If the market price rises, firms can earn more revenue per unit sold. Assuming costs have not changed, producing more becomes more profitable, so firms are willing to supply more.
2. Marginal costs often rise in the short run
The short run is a period of time in which at least one factor of production is fixed, such as factory size, machinery or shop space.
As output rises in the short run, firms may have to use overtime, more expensive inputs, or crowded equipment. This can cause marginal cost — the extra cost of producing one more unit — to rise.
So firms may require a higher price before they are willing to produce extra output.
Explaining upward-sloping supply with marginal cost
A bakery sells batches of bread. The marginal cost of producing extra batches rises as the ovens become busier: the 10th batch costs £18, the 11th costs £22, the 12th costs £27 and the 13th costs £33.
-
If the market price is £25 per batch, producing the 10th and 11th batches is profitable because their marginal costs are below £25. The 12th batch is not profitable because it costs £27 to produce.
-
If the market price rises to £35, the bakery can profitably produce the 12th and 13th batches as well, because £35 covers their marginal costs.
-
The higher price causes an extension of supply: the bakery moves up along its supply curve and produces more because extra output has become profitable.
Movements along curves versus shifts of curves
A change in the good’s own price causes a movement along the existing demand or supply curve.
A change in any non-price factor shifts the whole curve.
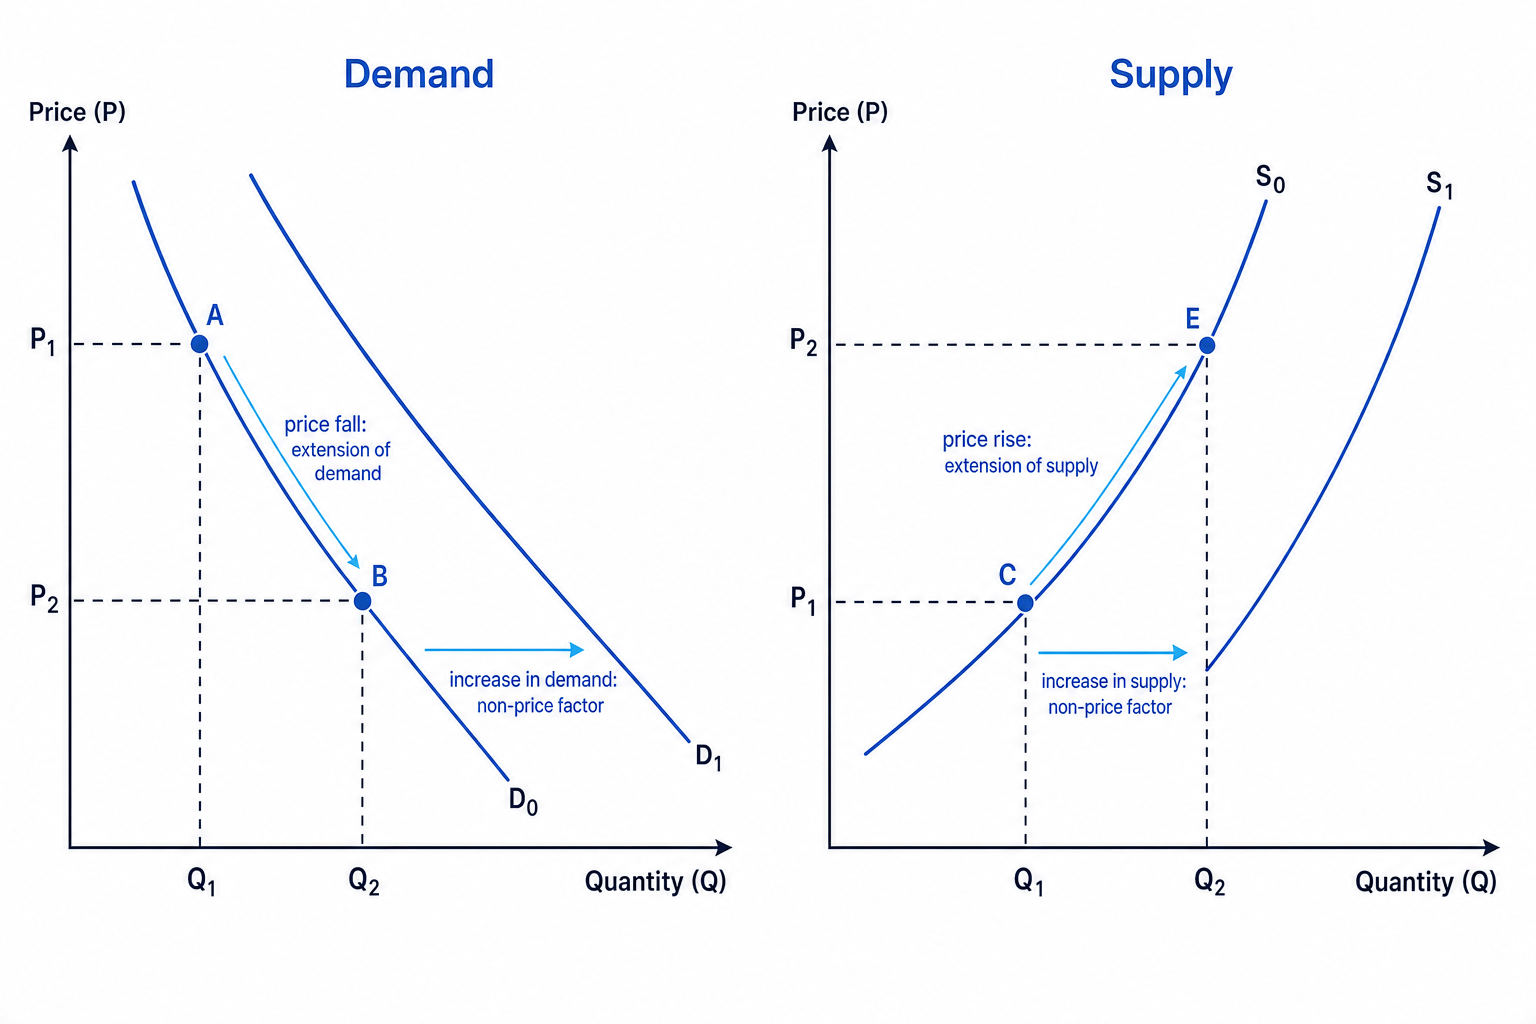
Calling every change a shift
If the product’s own price changes, it is a movement along the curve. If income, tastes, costs, technology, taxes or another non-price factor changes, it is a shift of the curve.
Main influences on demand
A rise in demand shifts the demand curve to the right. A fall in demand shifts it to the left.
| Factor | How it can affect demand | Example |
|---|---|---|
| Own price | Causes a movement along the demand curve | A lower cinema ticket price causes an extension of demand |
| Income | Higher income raises demand for normal goods but lowers demand for inferior goods | During a cost-of-living squeeze, demand may rise for supermarket own-brand products |
| Price of substitutes | If a substitute becomes more expensive, demand for this good rises | If coffee becomes more expensive, demand for tea may rise |
| Price of complements | If a complement becomes more expensive, demand for this good falls | If petrol becomes more expensive, demand for large petrol cars may fall |
| Tastes and fashion | Popularity, advertising or trends can shift demand | Demand for reusable water bottles rose as environmental concerns increased |
| Population and demographics | More consumers or a change in age structure shifts demand | An ageing population may increase demand for healthcare services |
| Expectations | Expected future price rises can increase current demand | If households expect energy bills to rise, they may buy insulation sooner |
| Interest rates and credit | Higher borrowing costs can reduce demand for expensive items | Higher Bank of England interest rates may reduce demand for new cars bought on finance |
A substitute is a good that can be used instead of another good. A complement is a good that is used together with another good.
Classifying demand influences
A UK supermarket reports rising sales of own-brand pasta during a period of falling real incomes, while restaurant bookings fall.
-
Falling real incomes reduce households’ purchasing power, so consumers look for cheaper ways to meet the same needs.
-
Own-brand pasta may behave like an inferior good or a cheaper substitute for eating out, so its demand shifts to the right.
-
Restaurant meals are usually normal goods, so lower real incomes reduce demand for them. Their demand curve shifts to the left.
Main influences on supply
A rise in supply shifts the supply curve to the right. A fall in supply shifts it to the left.
| Factor | How it can affect supply | Example |
|---|---|---|
| Own price | Causes a movement along the supply curve | A higher market price for milk encourages farmers to supply more |
| Costs of production | Higher costs reduce supply | Rising energy prices can reduce supply from energy-intensive manufacturers |
| Technology | Better technology increases productivity and supply | Faster checkout technology can increase supermarket capacity |
| Taxes | Indirect taxes raise costs and reduce supply | A higher tax on sugary drinks can shift supply left |
| Subsidies | Subsidies lower production costs and increase supply | A subsidy for renewable energy can shift supply right |
| Number of firms | More firms in the market usually increase supply | More coffee shops opening increases market supply |
| Weather and shocks | Bad weather or disruption can reduce supply | Poor harvests reduce supply of fruit and vegetables |
| Exchange rates | A weaker pound raises the cost of imported inputs | If £1 buys fewer dollars, imported oil becomes more expensive for UK firms |
| Regulation | Stricter rules may increase costs and reduce supply | New safety standards may raise compliance costs |
Fast way to remember supply factors
Ask: “Has it changed the firm’s cost, productivity, number of sellers, or willingness to produce?” If yes, it probably shifts supply.
Applying demand and supply to product markets
In exam answers, you often need to explain the chain of reasoning clearly.
For demand:
- Consumer income, tastes or related prices change.
- Willingness and ability to buy at each price changes.
- The demand curve shifts.
For supply:
- Costs, technology, taxes, subsidies or producer expectations change.
- Willingness and ability to sell at each price changes.
- The supply curve shifts.
If you later combine demand and supply, the market price where quantity demanded equals quantity supplied is called equilibrium. A demand increase usually creates upward pressure on price and raises quantity traded. A supply increase usually creates downward pressure on price and raises quantity traded.
Evaluation: how realistic is the model?
The basic model is powerful, but it simplifies reality.
Consumers may not always maximise utility because of imperfect information, habits, loyalty schemes or behavioural biases. Firms may not always maximise short-run profit; for example, a start-up may accept losses to build market share.
The size of the effect also depends on context. A small rise in income may have little effect on demand for necessities, while a large rise in energy costs may strongly reduce supply for firms with thin profit margins.
In the exam
-
Start by defining the key term: product market, demand, supply, marginal utility, or price taker.
-
Decide whether the change is caused by the product’s own price or a non-price factor. Own price means movement along; non-price factor means shift.
-
Build a clear chain: factor changes, incentive changes, demand or supply shifts, then price and quantity effects if equilibrium is relevant. Add context, such as UK cost-of-living pressures, energy costs, interest rates or supply-chain disruption.
Check yourself
- Why does diminishing marginal utility help explain a downward-sloping demand curve?
- For each case, is it a movement or a shift: the price of smartphones falls; wages for coffee-shop staff rise; incomes rise for luxury holidays?
- Why might a firm need a higher price to produce more output in the short run?
