

What you'll learn
- What aggregate supply means in a macroeconomic AD/AS model.
- Why the Keynesian long-run aggregate supply curve has different sections.
- Why LRAS becomes vertical at full employment output.
- How supply-side policies can shift LRAS to increase productive potential.
Starting point: aggregate supply in macroeconomics
In macroeconomics, we often analyse the whole economy using aggregate demand and aggregate supply. Aggregate demand (AD) means total planned spending in the economy at different price levels. Aggregate supply (AS) looks at the output side: how much the economy can produce.
Aggregate supply (AS)
Aggregate supply (AS) is the total quantity of goods and services that firms in an economy are willing and able to produce at different average price levels over a period of time.
The vertical axis on an AS diagram is the price level, meaning the average level of prices in the economy. This might be measured using an index such as CPI, where the base year equals 100.
The horizontal axis is real GDP, meaning the value of national output adjusted for inflation. Real GDP is used because we want to measure actual output, not just higher money values caused by rising prices.
Short run versus long run
The short run is a period in which some costs, especially wages and contracts, may be fixed or slow to adjust. The short-run aggregate supply (SRAS) curve is usually upward sloping: when the price level rises, firms may find production more profitable and increase output.
The long run is a period in which productive capacity can change and prices, wages and expectations have more time to adjust. The key curve for this Eduqas section is long-run aggregate supply (LRAS).
Long-run aggregate supply (LRAS)
Long-run aggregate supply (LRAS) shows the maximum sustainable level of real output an economy can produce when its resources are being used at their normal capacity.
A vital idea is full employment output. This does not mean zero unemployment. It means the economy is using labour and other resources efficiently, with no major cyclical unemployment caused by weak demand.
Full employment output
Full employment output is the level of real GDP produced when the economy is operating at its productive potential, allowing for normal frictional and structural unemployment.
Calculating a negative output gap
An output gap measures the difference between actual real GDP and potential real GDP. This helps you decide whether the economy has spare capacity.
Calculating a negative output gap
-
Suppose actual real GDP is £2,160bn and potential real GDP is £2,250bn. The economy is producing £90bn less than its estimated potential.
-
Express the gap as a percentage of potential output:
Output gap=actual real GDP−potential real GDPpotential real GDP×100\text{Output gap} = \frac{\text{actual real GDP} - \text{potential real GDP}}{\text{potential real GDP}} \times 100Output gap=potential real GDPactual real GDP−potential real GDP×100 Output gap=2160−22502250×100=−4.0%\text{Output gap} = \frac{2160 - 2250}{2250} \times 100 = -4.0\%Output gap=22502160−2250×100=−4.0% -
The negative sign matters: actual output is 4.0% below potential output. This suggests spare capacity, so extra demand may raise real GDP without much inflationary pressure.
The Keynesian LRAS curve
The Keynesian view is associated with John Maynard Keynes. Keynesians argue that economies can operate below full employment for long periods if aggregate demand is too weak.
The Keynesian LRAS curve is useful because it shows that the effect of higher demand depends on how close the economy already is to capacity.
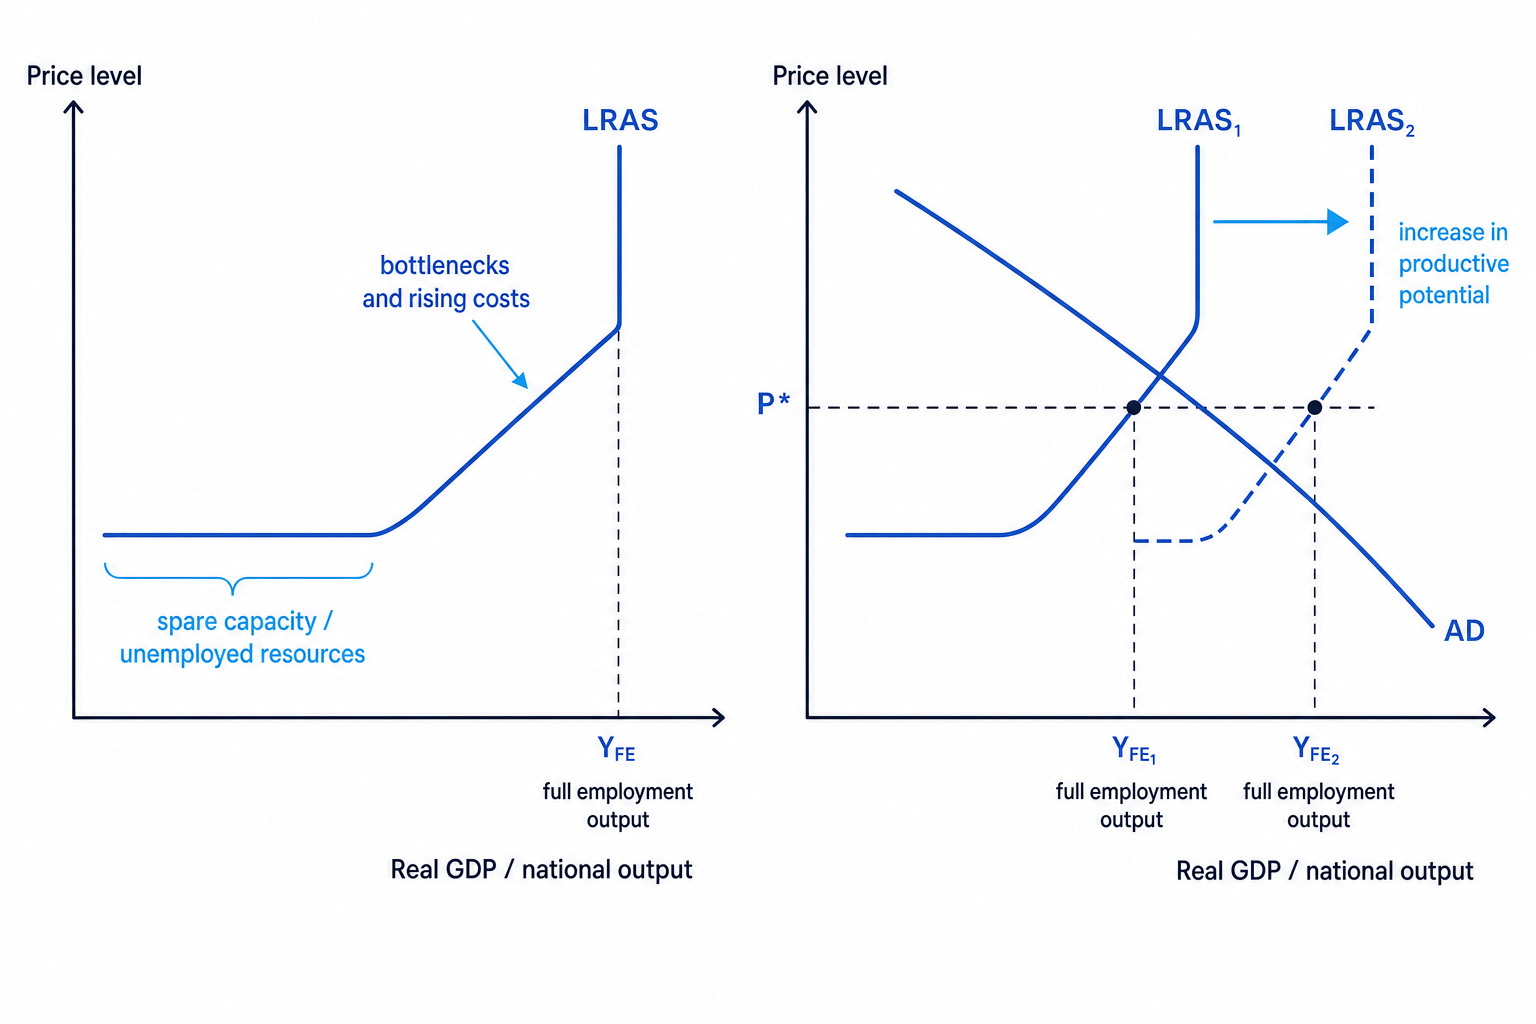
The horizontal section: spare capacity
At low levels of real GDP, the economy has spare capacity. This means there are unemployed workers, unused machinery, empty office space, or factories operating below normal capacity.
In this range, firms can increase output without needing to raise prices much. They can hire unemployed workers and use idle capital.
The upward-sloping section: bottlenecks
As output rises, the economy moves closer to capacity. Some industries may begin to face bottlenecks, meaning shortages or constraints that prevent output from expanding smoothly.
For example, construction firms may struggle to find skilled electricians, or ports may become congested. Firms may need to pay overtime, bid up wages, or pay more for scarce inputs. So real GDP rises, but the price level also begins to rise.
The vertical section: full employment output
At full employment output, LRAS becomes vertical. This is crucial for the spec.
At this point, the economy cannot sustainably produce more real output simply because the price level rises. Extra aggregate demand mainly creates inflation rather than higher real GDP.
Why Keynesian LRAS becomes vertical
The Keynesian LRAS curve is horizontal when there is spare capacity, upward sloping when bottlenecks appear, and vertical at full employment output because the economy has reached its productive potential.
Predicting the effect of higher aggregate demand
Using the Keynesian LRAS curve
-
If actual real GDP is well below full employment output, the economy is likely to be on the horizontal or gently upward-sloping part of the Keynesian LRAS curve.
-
A rise in AD can then lead to a large increase in real GDP because firms can use unemployed labour and idle capital.
-
If actual real GDP is already at full employment output, the same rise in AD mainly increases the price level because output cannot expand sustainably beyond productive potential.
Forgetting the vertical section
Do not write that the Keynesian LRAS curve is always horizontal. Keynesians emphasise spare capacity, but Eduqas expects you to know that LRAS is vertical at full employment output.
What shifts LRAS?
A movement along an AS curve happens because the price level changes. A shift in LRAS happens when the economy’s productive potential changes.
A rightward shift in LRAS means the economy can produce more real GDP at each price level. A leftward shift means productive potential has fallen.
Factors of production
The factors of production are the resources used to produce goods and services: land, labour, capital and enterprise.
Main causes of LRAS shifts
1. Changes in the quantity of factors of production
If the economy has more resources available, LRAS can shift right.
Examples include:
- A larger labour force due to higher participation, migration, or later retirement.
- More capital stock, such as factories, machinery, transport links and digital infrastructure.
- Greater availability of land or natural resources.
- More enterprise, meaning more people willing and able to organise production and take business risks.
A fall in labour supply, weak investment, or reduced access to imported inputs could shift LRAS left or slow its growth.
2. Changes in the quality of factors of production
LRAS can also shift right if the quality of resources improves. The most important example is human capital, meaning the skills, education, training and health of workers.
A healthier, better-trained workforce can produce more output per hour. This raises productivity, which means output per unit of input.
UK application matters here. Since the 2008 financial crisis, the UK has experienced weak productivity growth, sometimes called the “productivity puzzle”. This has limited growth in potential output and therefore limited rightward shifts in LRAS.
3. Changes in the efficiency of resource use
Even if the quantity of resources stays the same, the economy can produce more if resources are allocated and used more efficiently.
Examples include:
- Better management practices.
- Improved transport and broadband infrastructure.
- More competitive markets encouraging firms to cut waste.
- Less time lost through supply-chain delays.
Brexit-related trade frictions, for example, may reduce efficiency for some UK firms by increasing paperwork, delays and costs when trading with the EU.
4. Changes in the state of technology
Technological progress allows more output to be produced from the same resources.
Examples include:
- Automation in manufacturing.
- Artificial intelligence improving data analysis and business processes.
- Renewable energy technology reducing long-run energy costs.
- Medical technology improving workforce health and participation.
Technology can shift LRAS right, but the size of the effect depends on adoption, investment and whether workers have the skills to use it.
5. Changes in factor market flexibility
A factor market is a market for a factor of production, such as the labour market or capital market. Flexibility means resources can move more easily to where they are most productive.
For example, if workers can retrain and move between regions or sectors, the economy can respond better to changing demand. If planning rules, occupational licensing, skills shortages or immobile housing markets prevent this, LRAS may be lower.
Confusing SRAS shocks with LRAS shifts
A temporary rise in oil or gas prices usually shifts SRAS left because firms’ costs rise. It shifts LRAS left only if it permanently reduces productive capacity or long-run efficiency.
Policy instruments that can shift LRAS
Supply-side policies
Supply-side policies are government or regulatory actions designed to increase productive capacity, improve productivity, or make markets work more efficiently.
Policy instruments that can shift LRAS right include:
- Education and training: improves human capital, skills and productivity.
- Apprenticeships and vocational schemes: reduce skill shortages in sectors such as construction, engineering and health care.
- Infrastructure spending: transport, energy grids and broadband can improve efficiency.
- R&D subsidies and tax credits: encourage innovation and technological progress.
- Investment incentives: lower corporation tax or capital allowances can encourage firms to buy new capital equipment.
- Labour market reforms: childcare support, health policies, or pension reforms may increase labour force participation.
- Competition policy and deregulation: can reduce inefficiency, though poor deregulation may create market failure.
- Immigration policy: can increase labour supply and fill skill gaps, though it may also create pressure on housing and public services if not planned well.
Analysing a supply-side policy
-
Suppose the government expands apprenticeships in engineering and funds faster rail links between northern cities. The apprenticeship policy mainly improves labour quality, while the rail investment improves the efficiency with which labour and capital are used.
-
Higher skills and better transport can raise productivity. Firms may be able to produce more output with the same number of workers and machines.
-
LRAS shifts right because the economy’s productive potential increases. Full employment output rises, so long-run growth can increase without the same inflationary pressure.
-
The judgement depends on time lags and effectiveness. If training is poorly matched to employer needs or infrastructure projects face cost overruns, the rightward LRAS shift may be small or delayed.
AD now, LRAS later
Some policies affect both sides of the economy. Infrastructure spending raises AD immediately because it is government expenditure, but it may shift LRAS right later if it improves productive capacity.
Why LRAS shifts matter
A rightward shift in LRAS can help achieve several macroeconomic objectives:
- Higher potential economic growth.
- Lower inflationary pressure for a given level of AD.
- Lower unemployment if AD is strong enough to use the extra capacity.
- Improved international competitiveness if productivity rises and unit costs fall.
A leftward shift in LRAS is more damaging. It can reduce real GDP and increase inflationary pressure at the same time. This is linked to stagflation, where weak or stagnant output occurs alongside high inflation.
However, do not assume every supply-side policy is automatically successful. In evaluation, ask about cost, time lag, incentives, distributional effects and government failure. For example, cutting taxes may encourage investment, but it may also reduce tax revenue needed for education or infrastructure.
In the exam
-
Draw the Keynesian LRAS carefully: horizontal with spare capacity, upward sloping with bottlenecks, and vertical at full employment output.
-
When explaining a shift, link the policy or event to productive capacity: quantity, quality or efficiency of factors, technology, or factor market flexibility.
-
Evaluate using time period and effectiveness: a policy may raise AD quickly but only shift LRAS after years, and the impact depends on productivity gains.
Check yourself
- Why does the Keynesian LRAS curve become vertical at full employment output?
- Give two examples of policies that could improve the quality or efficiency of factors of production.
- Why might a rise in energy prices affect SRAS but not necessarily LRAS?
