

What you'll learn
- What short run aggregate supply means in macroeconomic theory.
- Why the SRAS curve is usually drawn upward sloping from left to right.
- How changes in labour costs, commodity prices, exchange rates, taxation, subsidies, productivity and technology shift SRAS.
- How to explain SRAS using clear AO1, AO2, AO3 and AO4 chains.
The basic macro building blocks
Before SRAS makes sense, you need three core terms.
Price level
The price level is the average level of prices across the whole economy. In the UK, it is often discussed using an index such as the Consumer Prices Index, where the base year is set to 100.
Real GDP
Real GDP is the value of an economy’s output after adjusting for inflation. It measures the volume of goods and services produced, not just their money value.
Aggregate supply
Aggregate supply is the total quantity of goods and services that firms in an economy are willing and able to produce at different price levels.
So, when we draw SRAS, the vertical axis is the price level, and the horizontal axis is real GDP.
What does “short run” mean?
In macroeconomics, the short run is not a fixed number of months. It means a period in which some things are assumed to be slow to change.
For SRAS analysis, the key assumptions are that:
- input prices are fixed or sticky for a while, especially wages and supply contracts
- productivity is fixed
- technology is fixed
Short run aggregate supply
Short run aggregate supply (SRAS) shows the relationship between the price level and the amount of real output firms are willing to supply, assuming input prices, productivity and technology are unchanged.
This “holding other things constant” assumption matters. If wages, oil prices, taxes, subsidies or productivity change, we do not move along the same SRAS curve — the whole SRAS curve shifts.
Why SRAS slopes upward
The SRAS curve is assumed to slope upwards from left to right. This means that, in the short run, a higher price level is associated with a higher level of real GDP supplied.
The main logic is about profitability.
If the prices firms receive for their output rise, but their input costs are fixed in the short run, producing more becomes more profitable. Firms may increase output by using spare capacity, offering overtime, hiring temporary workers or increasing production runs.
A second reason is that producing extra output often raises marginal cost, which is the cost of producing one additional unit. As firms get closer to full capacity, they may need to pay overtime rates, use less efficient machinery or bid for scarce inputs. Therefore, they need a higher price level to justify supplying more output.
Why the curve rises
SRAS slopes upward because output prices can rise faster than input costs in the short run, so firms have an incentive to expand production.
Why a higher price level can raise output
Imagine a simplified economy where firms sell output for £100 per unit and face input costs of £80 per unit.
-
At the starting point, the profit margin is £20 per unit because £100 minus £80 equals £20.
-
Suppose the general price level rises, so firms can now sell output for £110 per unit, while wage and supply contracts keep input costs temporarily fixed at £80.
-
The profit margin rises to £30 per unit, so producing extra output becomes more attractive.
-
Firms respond by increasing production, so the economy moves up along the SRAS curve to a higher price level and higher real GDP.
SRAS in the AD/AS diagram
Aggregate demand (AD) is total planned spending on domestic output at each price level. SRAS is usually used with AD to analyse changes in real GDP, inflation and unemployment.
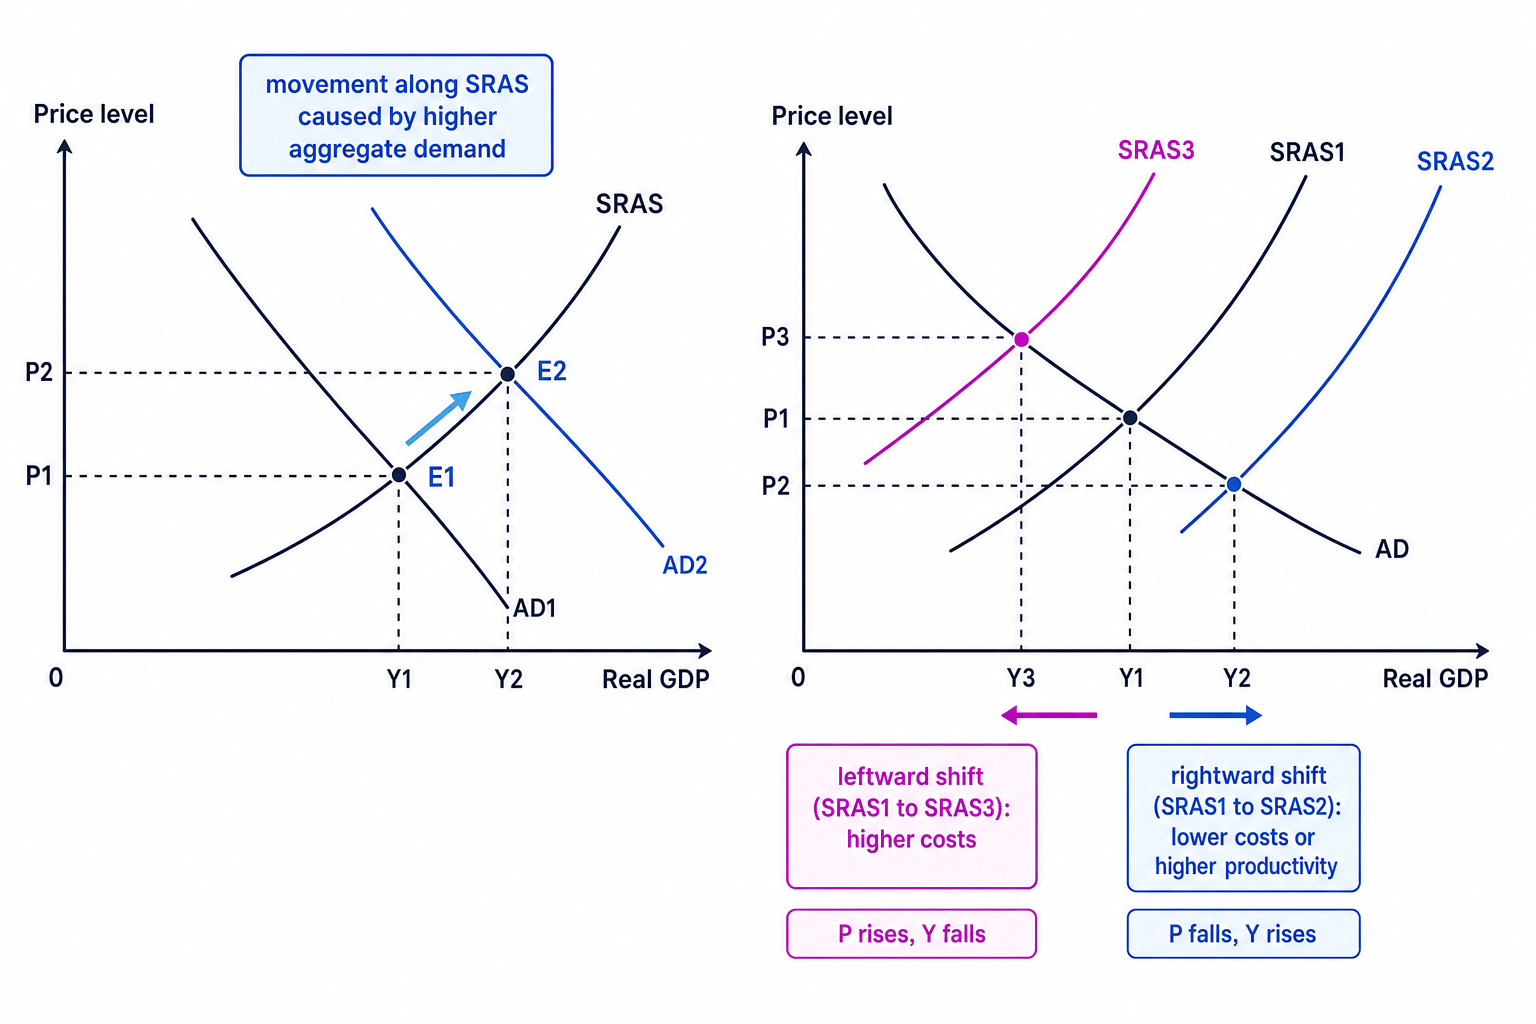
The diagram below shows two important ideas: a movement along SRAS when AD changes, and a shift of SRAS when production conditions change.
Movement along SRAS
A movement along SRAS happens when the price level changes but the underlying conditions of production stay the same.
For example, if consumer confidence rises and AD shifts right, firms face more demand. They expand output, but because production costs tend to rise as output increases, the price level also rises.
Shift of SRAS
A shift of SRAS happens when firms’ costs or productive efficiency change at every price level.
- SRAS shifts right when firms can produce more at each price level.
- SRAS shifts left when firms can produce less at each price level.
Movement versus shift
Do not say SRAS shifts just because real GDP rises. If the cause is stronger aggregate demand, it is usually a movement along SRAS. SRAS shifts only when supply-side conditions change.
Why this SRAS model is linked to Monetarist and Neo-Classical economists
This upward-sloping SRAS curve is associated with Monetarist and Neo-Classical economists.
Monetarists, especially Milton Friedman, argued that changes in aggregate demand can affect real output in the short run because wages and input prices do not adjust instantly. However, in the long run, the economy tends to return towards its natural or potential level of output.
Neo-Classical economists also tend to emphasise markets adjusting over time. In their view, short-run deviations from potential output can occur, but flexible prices and wages help restore equilibrium in the longer run.
This is why many standard AD/AS diagrams use:
- an upward-sloping SRAS curve in the short run
- a vertical long-run aggregate supply curve in the long run
Economist link
If an essay asks about demand-side policy, you can use the Monetarist idea that AD may increase real GDP in the short run, but the effect may fade as wages and input costs adjust.
What shifts SRAS?
Labour costs
Labour costs include wages, employer National Insurance contributions, pension contributions and other costs of employing workers.
If wages rise faster than productivity, firms’ unit labour costs rise. This means each unit of output becomes more expensive to produce, so SRAS shifts left.
Productivity
Productivity is output per unit of input. Labour productivity is usually measured as output per worker or output per hour worked.
Using unit labour costs
A worker is paid £500 per week and produces 50 units of output per week.
-
The initial labour cost per unit is £500 divided by 50 units, which equals £10 per unit.
-
If the wage rises to £550 while output stays at 50 units, labour cost per unit becomes £550 divided by 50 units, which equals £11 per unit.
-
Unit labour cost has risen by £1 per unit, so firms’ costs are higher at each price level. SRAS shifts left.
-
If productivity also rises to 55 units, labour cost per unit becomes £550 divided by 55 units, which equals £10 per unit. The productivity improvement offsets the wage rise, so SRAS may not shift left.
UK application: during the cost-of-living squeeze, workers demanded higher wages to maintain real incomes. If wage growth is not matched by productivity growth, firms may face cost pressure.
Commodity prices
Commodities are raw materials such as oil, gas, wheat, copper and metals.
A rise in global oil or gas prices increases costs for transport, heating, electricity and manufacturing. This shifts SRAS left and can create cost-push inflation, where the price level rises because production costs increase.
A fall in commodity prices shifts SRAS right because firms can produce at lower cost.
UK application: the global energy price shock after Russia’s invasion of Ukraine contributed to higher business costs and inflationary pressure in the UK and Europe.
Exchange rates
The exchange rate is the price of one currency in terms of another. For example, £1 = $1.25 means one pound buys 1.25 US dollars.
If the pound depreciates, such as from £1 = 1.30to£1=1.30 to £1 = 1.30to£1=1.20, imported inputs priced in dollars become more expensive for UK firms. This can shift SRAS left.
If the pound appreciates, imported raw materials and components become cheaper, which can shift SRAS right.
Mixing up AS and AD effects
A depreciation may increase export demand, which affects AD, but it can also raise import costs, which affects SRAS. Keep these two channels separate in your analysis.
Taxation and subsidies
Taxes that raise firms’ production costs shift SRAS left. Examples include higher fuel duty, business rates or employer National Insurance contributions.
Subsidies shift SRAS right because they reduce firms’ effective costs of production. For example, a government subsidy for renewable energy or training may lower costs and increase output at each price level.
Productivity and technology
Technology means the methods, machinery, software and knowledge used to turn inputs into output.
If firms become more productive, they can produce more output from the same resources. Unit costs fall, so SRAS shifts right. This can increase real GDP while reducing inflationary pressure.
Examples include:
- better logistics systems
- automation
- improved worker training
- faster broadband and digital infrastructure
- more reliable transport networks
SRAS versus LRAS
A permanent improvement in technology or productivity may shift both SRAS and long-run aggregate supply. In this topic, focus on the short-run effect: lower unit costs and more output at each price level.
Analysing a leftward SRAS shift
A leftward shift of SRAS is often bad for macroeconomic performance because it can cause stagflation.
Stagflation
Stagflation is a situation where inflation rises while real GDP growth weakens or unemployment rises.
Analysing an energy-price shock
Suppose global gas prices rise sharply, increasing electricity costs for UK firms.
-
Higher gas prices raise firms’ production costs, especially for energy-intensive industries such as chemicals, steel, food processing and transport.
-
At each price level, producing output is now less profitable, so SRAS shifts left.
-
With AD unchanged, the new equilibrium has a higher price level and lower real GDP.
-
This creates a policy dilemma: the Bank of England may raise interest rates to reduce inflation, but tighter monetary policy could also reduce AD and weaken growth further.
Evaluating SRAS shifts
In stronger answers, do not stop after saying “SRAS shifts left” or “SRAS shifts right”. Add judgement.
Useful evaluation points include:
- Magnitude: how large is the cost change, and how important is that input to firms?
- Duration: is the shock temporary, like a short oil price spike, or persistent, like long-term energy insecurity?
- Spare capacity: if firms have lots of unused capacity, output may respond more easily.
- Productivity response: firms may absorb wage rises if productivity improves.
- Policy reaction: subsidies, tax cuts or interest rate changes may offset or worsen the effect.
- Import dependence: exchange rate changes matter more when firms rely heavily on imported inputs.
In the exam
-
Define SRAS clearly, including the short-run assumptions of fixed input prices, productivity and technology.
-
Separate movements along SRAS from shifts of SRAS by identifying whether the cause is AD-side or cost/productivity-side.
-
For analysis, write the chain: shock → costs or productivity → SRAS shift → price level and real GDP → inflation, employment or growth effects.
-
For evaluation, judge the size, duration and context of the shift, using examples such as energy prices, wage growth, exchange rates or subsidies.
Check yourself
-
Why does SRAS slope upward in the short run?
-
How would a depreciation of the pound affect SRAS for UK firms that import raw materials?
-
Why might a wage rise not shift SRAS left if productivity rises at the same time?
