What you'll learn
- What aggregate demand is and how it is built from spending components.
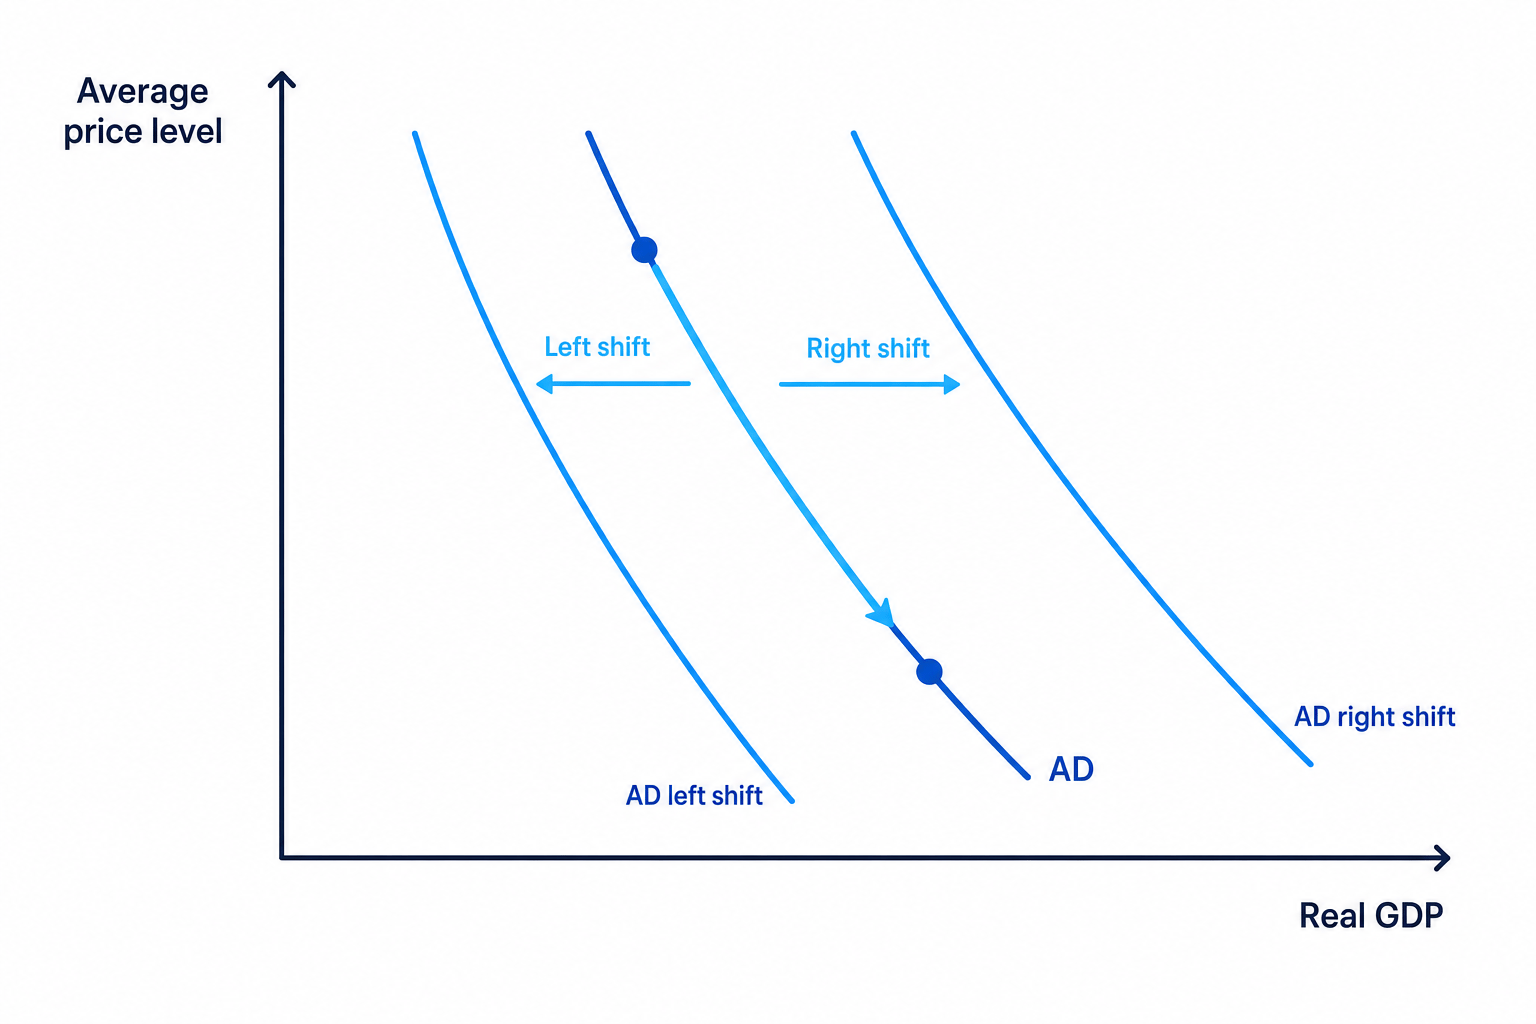
- Why the AD function slopes downward from left to right.
- How changes in consumption, investment, government spending and net exports shift AD.
- How to avoid mixing up a movement along AD with a shift of AD.
Start with the big picture
In macroeconomics, we are interested in demand for the whole economy’s output, not just one product. This is where aggregate demand comes in.
Aggregate demand
Aggregate demand (AD) is the total planned spending on domestically produced goods and services at each possible average price level over a period of time.
The AD function shows the relationship between:
- the average price level: the general level of prices across the economy, often measured by an index such as CPI; and
- real GDP: the value of national output adjusted for inflation.
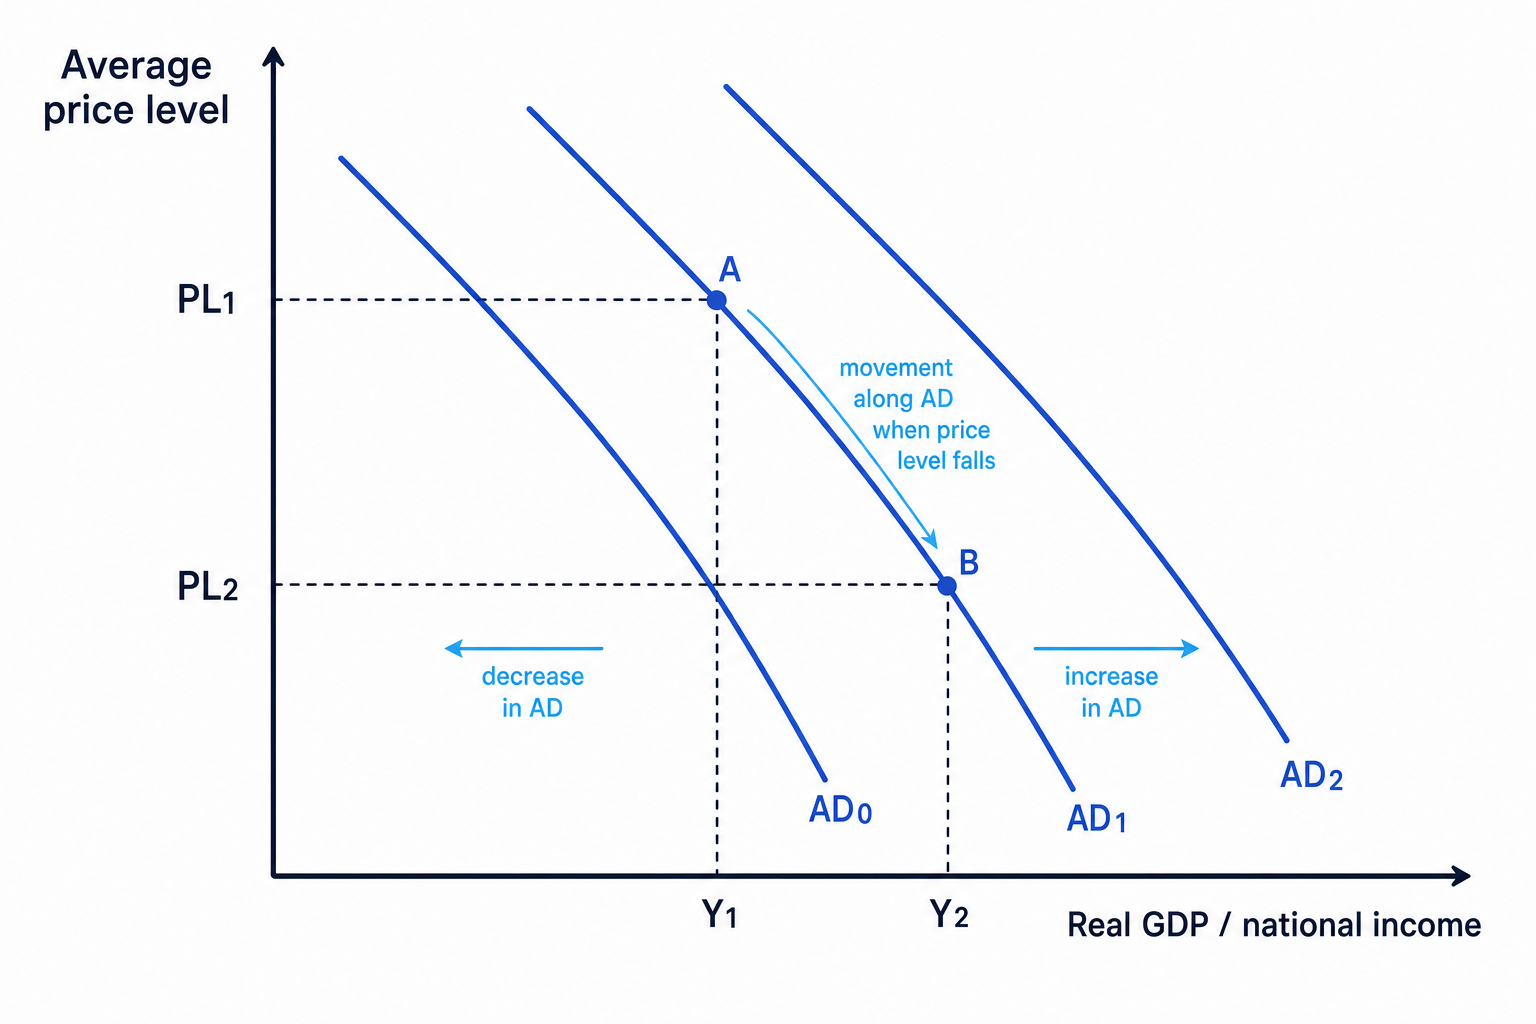
So, the AD curve is drawn with average price level on the vertical axis and real GDP / national income on the horizontal axis.
AD function
The AD function is the relationship showing how much real output is demanded at different average price levels, assuming other influences on spending are held constant.
The components of aggregate demand
Aggregate demand is usually written as:
AD=C+I+G+(X−M)\text{AD} = C + I + G + (X - M)AD=C+I+G+(X−M)Where:
- Consumption (C) is spending by households on goods and services.
- Investment (I) is spending by firms on capital goods, such as machinery, buildings and technology.
- Government spending (G) is spending by the public sector on goods and services, such as healthcare, education and infrastructure.
- Exports (X) are goods and services sold to other countries.
- Imports (M) are goods and services bought from other countries.
- Net exports are exports minus imports, so X−MX - MX−M.
Investment does not mean buying shares
In macroeconomics, investment usually means firms spending on capital goods. Buying shares is a financial transaction, not new spending on current output.
Why imports are subtracted
AD measures demand for domestically produced output. If UK households buy imported goods, that spending creates demand for output produced abroad, so it is subtracted.
Calculating aggregate demand
Suppose an economy has the following annual spending figures:
- Consumption = £1,450bn
- Investment = £300bn
- Government spending = £720bn
- Exports = £820bn
- Imports = £890bn
-
Calculate net exports first: X−M=820−890=−70X - M = 820 - 890 = -70X−M=820−890=−70, so net exports are −£70bn.
-
Substitute the values into the AD formula: AD=1450+300+720+(−70)=2400\text{AD} = 1450 + 300 + 720 + (-70) = 2400AD=1450+300+720+(−70)=2400.
-
Interpret the result: aggregate demand is £2,400bn, and the negative net export figure means imports are reducing demand for domestic output.
-
If investment later rises by £25bn, AD rises to £2,425bn before any multiplier effects, so the AD curve shifts to the right.
Why the AD curve slopes downward
The AD curve slopes downward from left to right because a lower average price level tends to increase the quantity of real output demanded.
This is not quite the same as a normal microeconomic demand curve. For one product, a lower price causes consumers to buy more partly because of substitution and income effects. For the whole economy, we use macroeconomic explanations.
Eduqas expects you to be able to explain at least one of these:
- the real balance effect
- the trade effect
- the interest rate effect
The real balance effect
Real balance effect
The real balance effect says that when the average price level falls, the real value of people’s money balances and savings rises, so they can afford to buy more goods and services.
For example, if prices fall, £1,000 in a bank account has more purchasing power. Households may feel wealthier and increase consumption. This raises the quantity of real GDP demanded.
The reverse also applies: if the price level rises, the real value of money falls, reducing purchasing power and planned consumption.
The trade effect
Trade effect
The trade effect says that a lower domestic price level makes a country’s goods and services more internationally competitive, increasing exports and reducing imports.
If the UK price level falls relative to other countries, UK exports become cheaper for overseas buyers. At the same time, UK consumers may switch away from relatively expensive imports towards domestic goods.
This increases net exports, so X−MX - MX−M rises, increasing AD.
Think competitiveness
For the trade effect, ask: “Are domestic goods becoming cheaper or more expensive relative to foreign goods?” Cheaper domestic goods tend to raise exports and reduce imports.
The interest rate effect
Interest rate effect
The interest rate effect says that a lower average price level reduces the demand for money for transactions, which may lower interest rates and encourage consumption and investment.
If prices are lower, households and firms need less money to buy the same volume of goods and services. With less demand for money, interest rates may fall, assuming the money supply is unchanged.
Lower interest rates can increase:
- consumption, because borrowing on credit becomes cheaper;
- investment, because firms face a lower cost of borrowing for capital projects.
Real-world central banks
In the real UK economy, the Bank of England actively sets Bank Rate to target inflation, so the simple interest rate effect may be partly offset by monetary policy. In the AD diagram, however, we usually apply the effect ceteris paribus, meaning “all other things equal”.
Explaining a movement along AD
Suppose the UK average price level falls, while taxes, confidence, exchange rates and government spending are unchanged.
-
Because the change is in the average price level itself, the AD curve does not shift; instead, there is a movement down along the existing AD curve.
-
Through the real balance effect, households’ money balances have greater purchasing power, so consumption is likely to rise.
-
Through the trade effect, UK output becomes more price competitive relative to foreign output, so exports may rise and imports may fall.
-
Through the interest rate effect, lower transaction demand for money may reduce interest rates, encouraging more consumption and investment.
-
Therefore, the economy moves from a higher price-level, lower-output point to a lower price-level, higher-output point on the AD curve.
Movements along AD versus shifts of AD
This distinction is very important.
A movement along AD happens when the average price level changes, with other factors held constant.
A shift of AD happens when one of the components of AD changes for a reason other than the price level.
Movement or shift?
A change in the price level causes a movement along AD. A change in C, I, G, X or M caused by another factor shifts the whole AD curve.
What shifts the AD curve?
A rightward shift means that at every price level, more real output is demanded. A leftward shift means that at every price level, less real output is demanded.
Changes in consumption
Consumption may rise if:
- real disposable income increases;
- consumer confidence improves;
- interest rates fall;
- wealth rises, for example through higher house prices.
Disposable income
Disposable income is income left after taxes have been paid and benefits have been received.
For example, during a cost-of-living squeeze, higher energy and food prices can reduce real disposable income, weakening consumption and shifting AD left.
Changes in investment
Investment may rise if:
- business confidence improves;
- interest rates fall;
- expected future profits rise;
- corporation tax falls;
- firms adopt new technology.
Keynes called volatile business confidence animal spirits: firms may invest more when they feel optimistic, even before profits have actually risen.
Changes in government spending
Government spending can shift AD directly. For example, higher spending on transport infrastructure, schools or the NHS increases GGG, shifting AD right.
This is part of fiscal policy, which means the use of government spending and taxation to influence the economy.
Changes in net exports
Net exports rise if exports increase or imports fall.
This may happen if:
- overseas economies grow, increasing demand for UK exports;
- the pound depreciates, making UK exports cheaper abroad;
- trade barriers fall, making it easier to sell overseas.
Exchange rate
An exchange rate is the price of one currency in terms of another. If the pound appreciates, for example from £1 = 1.25to£1=1.25 to £1 = 1.25to£1=1.35, the pound has strengthened.
A stronger pound can reduce AD because exports become more expensive for foreign buyers, while imports become cheaper for UK consumers. A weaker pound can increase AD, although it may also raise import costs and inflation.
Brexit-related trade frictions can affect net exports by increasing costs, paperwork or delays for firms trading with the EU.
Analysing a mixed AD shock
Suppose the UK government increases infrastructure spending by £12bn, but consumer confidence falls and the pound appreciates from £1 = 1.25to£1=1.25 to £1 = 1.25to£1=1.35.
-
The rise in infrastructure spending increases GGG, so this creates rightward pressure on AD.
-
Lower consumer confidence may cause households to save more and spend less, reducing CCC and creating leftward pressure on AD.
-
The appreciation of the pound makes UK exports more expensive overseas and imports cheaper for UK consumers, so X−MX - MX−M is likely to fall.
-
The overall shift depends on the relative size of these effects. If the fall in consumption and net exports is larger than the rise in government spending, AD shifts left overall.
How to describe AD shifts in analysis
When writing analysis, build a clear chain of reasoning:
Cause → component of AD → direction of shift → likely macroeconomic effect
For example:
A rise in Bank Rate increases borrowing costs for households and firms. This reduces consumption on credit and lowers investment spending. Since CCC and III fall, aggregate demand shifts left, reducing demand-pull inflationary pressure and weakening real GDP growth, ceteris paribus.
Putting inflation on the AD axis
The vertical axis of an AD diagram is the average price level, not the inflation rate. Inflation is the percentage change in the price level over time.
A quick evaluation point
AD shifting right does not automatically mean actual real GDP rises by the full amount. The final effect depends on aggregate supply, spare capacity and the multiplier.
If the economy has unemployed resources, higher AD may mainly increase real output. If the economy is near full capacity, higher AD may mainly increase the price level.
Multiplier
The multiplier is the process by which an initial change in spending leads to a larger final change in national income, because one person’s spending becomes another person’s income.
You do not need the full multiplier model for this specific AD function point, but it is useful for evaluation in longer answers.
In the exam
-
Start by defining AD and, if useful, write AD=C+I+G+(X−M)\text{AD} = C + I + G + (X - M)AD=C+I+G+(X−M).
-
If explaining the downward slope, use one clear effect such as the real balance effect, trade effect or interest rate effect.
-
If explaining a shift, name the AD component affected and say whether AD shifts left or right.
-
Draw the diagram carefully: price level on the vertical axis, real GDP on the horizontal axis, and label AD shifts as AD1 to AD2.
-
Add evaluation by considering short run versus long run, the size of the change, spare capacity, and whether other components move in the opposite direction.
Check yourself
- Why does a fall in the average price level cause a movement along AD rather than a shift of AD?
- How could a rise in interest rates affect both consumption and investment?
- If the pound appreciates from £1 = 1.25to£1=1.25 to £1 = 1.25to£1=1.35, what is the likely effect on net exports and AD?