What the AD function shows
What the AD function shows
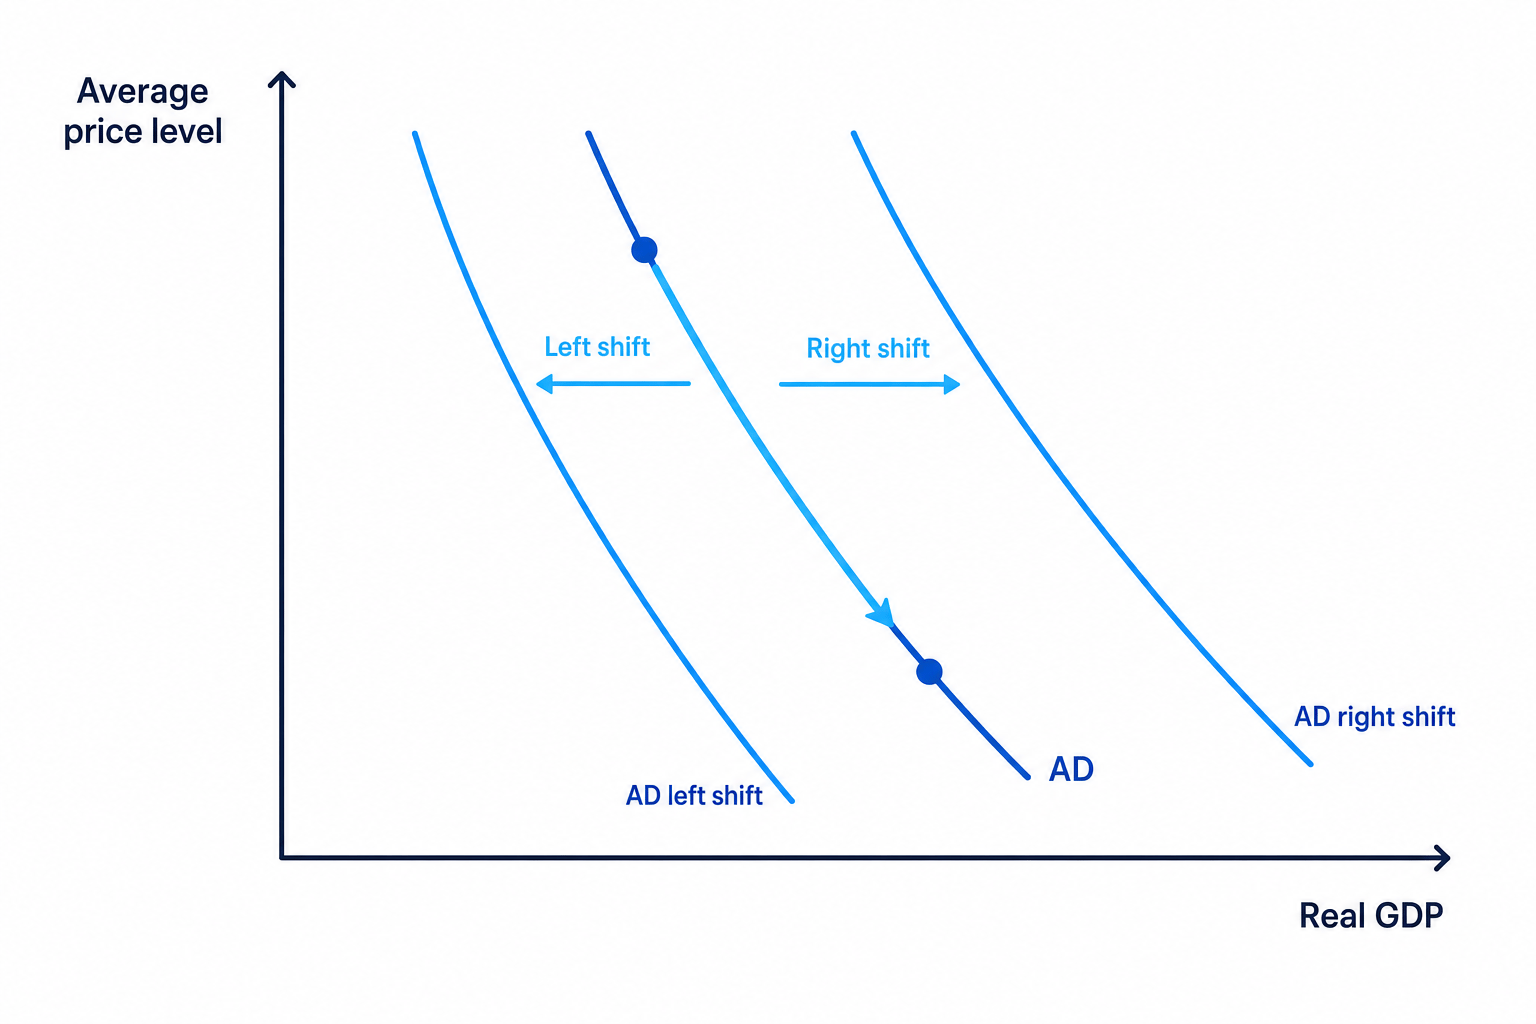
Aggregate demand is total planned spending on domestically produced goods and services at each possible average price level over a period. The AD function shows how the quantity of real output demanded changes when the average price level changes, holding other influences constant.