

What you'll learn
- What long run aggregate supply means and how it differs from short-run supply.
- Why Neo-classical economists draw LRAS as vertical.
- Why Keynesian economists may draw LRAS as horizontal, upward-sloping, then vertical.
- How flexible or sticky wages affect adjustment back to long-run equilibrium.
1. The building blocks: real GDP, prices and aggregate supply
Real GDP is the value of an economy’s output after removing the effect of inflation. It measures the quantity of goods and services produced.
The price level is the average level of prices across the economy, often measured using an index such as CPI.
Aggregate demand (AD) is total planned spending in the economy: consumption, investment, government spending and net exports.
Aggregate supply (AS) is the total output that firms are willing and able to supply at different price levels.
Short run versus long run
The short run is the period when some costs, especially wages, are fixed or slow to change. This is why short-run aggregate supply (SRAS) is usually drawn upward-sloping: a higher price level can make production more profitable before costs fully adjust.
The long run is the period in which prices and factor costs can fully adjust — at least in the Neo-classical model.
Long run aggregate supply (LRAS)
Long run aggregate supply (LRAS) shows the economy’s productive potential: the level of real output the economy can sustain when its resources are fully and efficiently used.
The key debate is: does the economy automatically return to this productive potential, or can it get stuck below it?
2. Productive potential and output gaps
Productive potential means the maximum sustainable level of real output an economy can produce using its available resources, technology and efficiency.
Full-employment output is the level of output where cyclical unemployment is zero. This does not mean unemployment is zero: frictional and structural unemployment can still exist.
An output gap measures the difference between actual real GDP and potential real GDP.
Output gap (%)=actual real GDP−potential real GDPpotential real GDP×100\text{Output gap (\%)}=\frac{\text{actual real GDP}-\text{potential real GDP}}{\text{potential real GDP}}\times 100Output gap (%)=potential real GDPactual real GDP−potential real GDP×100A negative output gap means the economy is producing below potential. A positive output gap means output is above its sustainable level, which may create inflationary pressure.
Calculating and interpreting an output gap
-
Suppose actual UK real GDP is £2,185bn and potential real GDP is £2,300bn. The economy is producing £115bn below potential.
-
Calculate the output gap as a percentage of potential output: 2,185−2,3002,300×100=−5.0%\frac{2{,}185-2{,}300}{2{,}300}\times 100=-5.0\%2,3002,185−2,300×100=−5.0%.
-
Because the result is negative, the economy has spare capacity: firms could increase output without immediately hitting full-capacity limits.
3. The Neo-classical view: LRAS is vertical
Neo-classical economists argue that in the long run, output is determined by the supply side of the economy: the quantity and quality of labour, capital, enterprise, natural resources and technology.
So LRAS is drawn as a vertical line at full-employment output. A change in AD can change the price level in the long run, but not the sustainable level of real GDP.
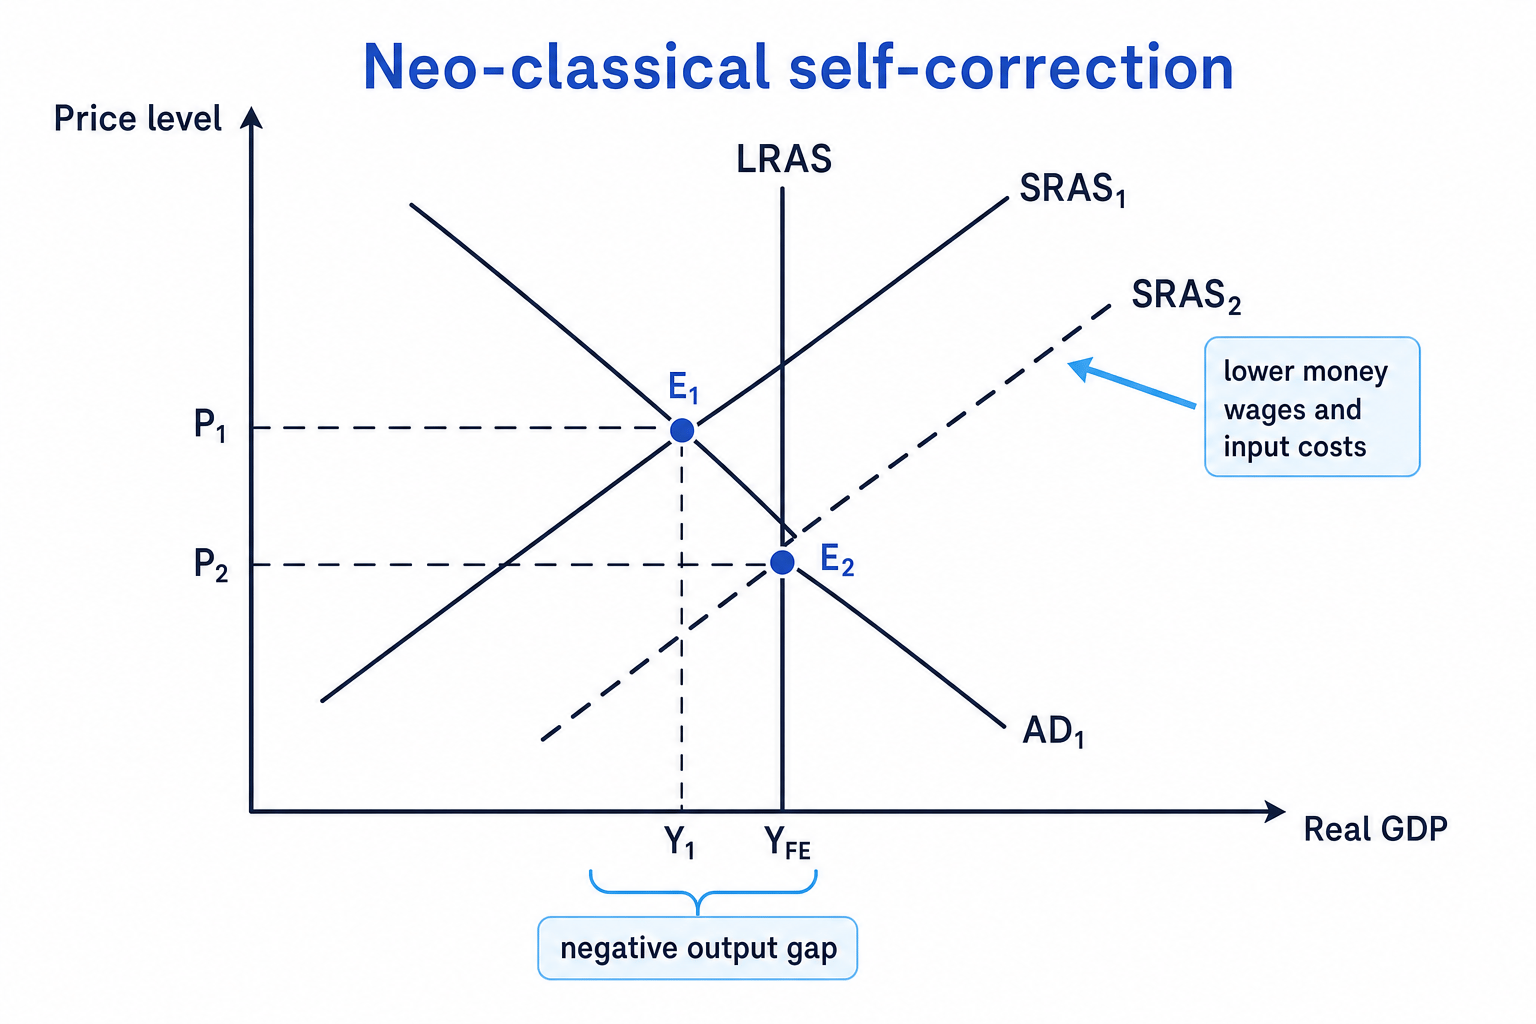
The diagram shows how a Neo-classical economy may self-correct after weak aggregate demand creates a negative output gap.
The Neo-classical view
If product and factor markets are flexible, the economy will tend to return to full-employment output without needing demand-side intervention.
The assumptions behind this view
A product market is a market for goods and services. A factor market is a market for factors of production, such as labour, land and capital.
The Neo-classical adjustment process depends on flexible markets. This means prices and wages can move enough to clear shortages and surpluses.
For example, if unemployment rises, workers may accept lower money wages — wages measured in pounds, not adjusted for inflation. Lower wages reduce firms’ costs, increasing SRAS.
How self-correction works
If AD is too low, actual output falls below full-employment output. Unemployment rises. In the Neo-classical model, this puts downward pressure on wages. Lower wages reduce costs, so SRAS shifts right. Real GDP returns to full-employment output, but at a lower price level.
Tracing self-correction after weak demand
-
Imagine AD falls, so the economy moves to output below full-employment output. Firms produce less, and cyclical unemployment rises.
-
With flexible labour markets, unemployed workers compete for jobs and money wages fall. This lowers firms’ unit labour costs.
-
Lower costs shift SRAS to the right. Firms can produce more at each price level, so real GDP rises back to full-employment output.
-
The long-run result is lower inflation or a lower price level, but output returns to its productive potential.
If AD is too high, the reverse happens. Labour and other inputs become scarce, wages and costs rise, SRAS shifts left, and output returns to full-employment output at a higher price level.
Vertical LRAS does not mean growth is impossible
A vertical LRAS means output is fixed at a moment in time by productive capacity. LRAS can still shift right over time if productivity, labour supply, investment or technology improve.
4. The Keynesian view: LRAS may not be vertical at equilibrium
Keynesian economists argue that economies can remain below full employment for long periods because markets may not adjust smoothly.
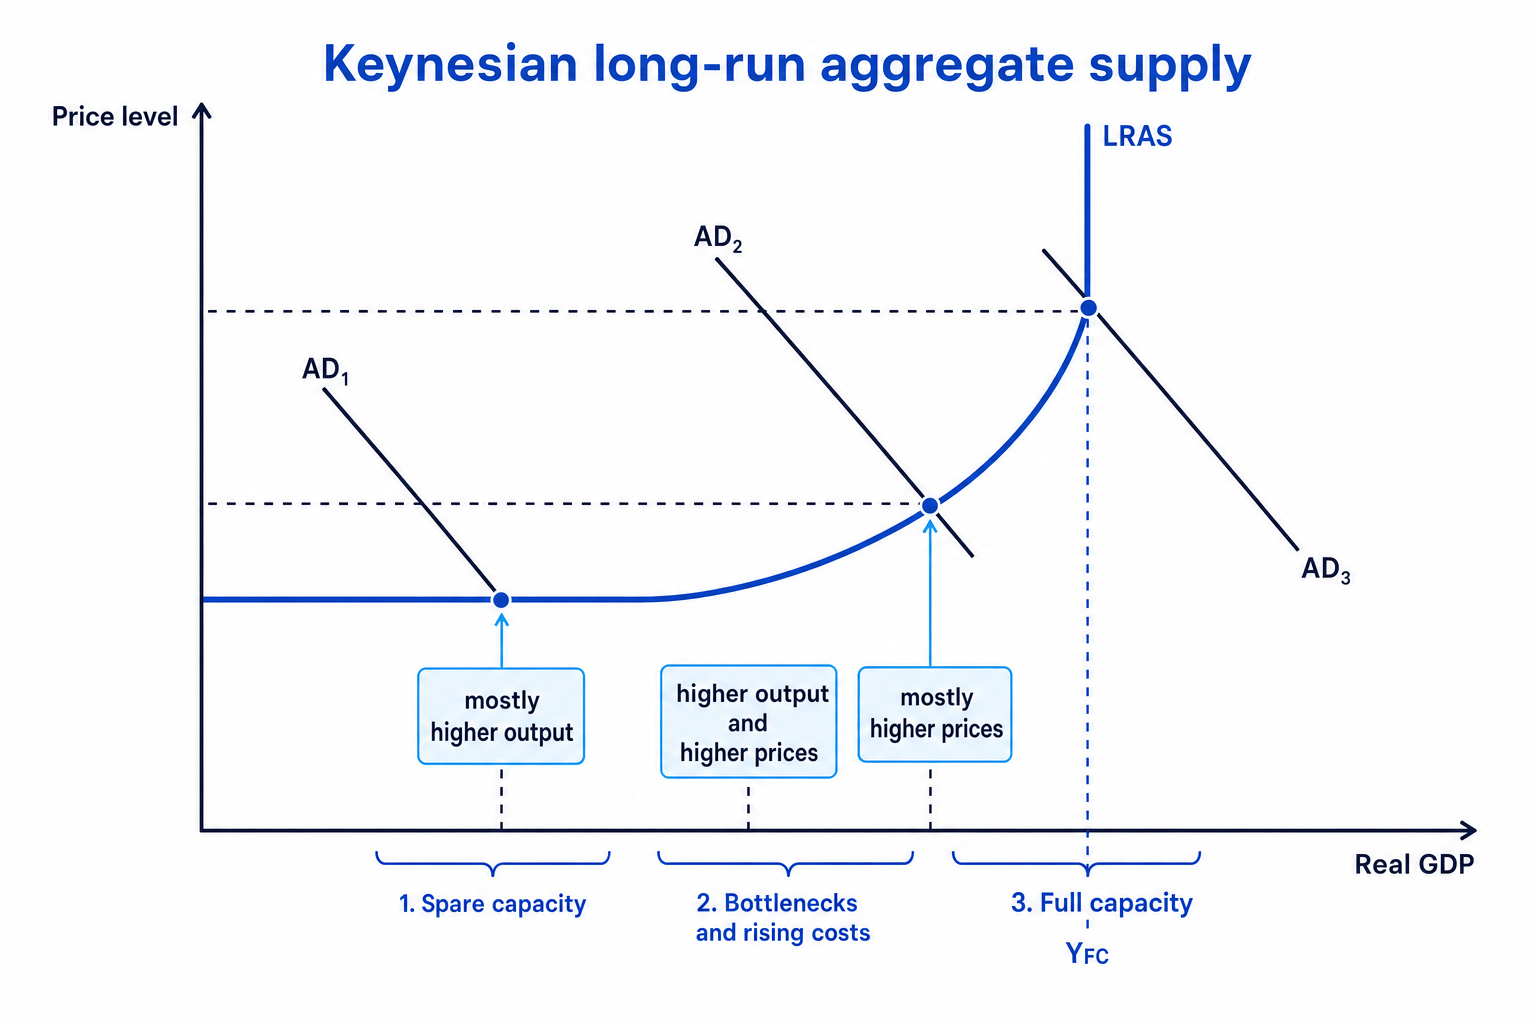
The Keynesian LRAS curve can have three sections: a horizontal section with spare capacity, an upward-sloping section as bottlenecks appear, and a vertical section at full capacity.
Sticky wages
Sticky wages are wages that do not adjust quickly downwards, even when unemployment rises. This may be due to contracts, minimum wage laws, trade unions, worker morale or resistance to nominal wage cuts.
If wages are sticky, the Neo-classical self-correction process may fail. Firms’ costs do not fall enough to shift SRAS right, so output may stay below full-employment output.
The Keynesian view
An economy can settle at an equilibrium below full employment if AD is too weak and wages or prices are slow to adjust.
Why the Keynesian LRAS has different sections
On the horizontal section, there is lots of spare capacity. Firms can increase output without needing to raise prices much.
On the upward-sloping section, spare capacity is running out. Some skilled workers, raw materials or transport networks become harder to find, so costs rise.
On the vertical section, the economy is at full capacity. More AD mainly causes demand-pull inflation rather than extra real output.
Predicting the effect of higher demand on a Keynesian LRAS
-
If the economy is on the horizontal section, higher AD allows firms to use unemployed labour and idle machinery. Real GDP rises with little inflationary pressure.
-
If the economy is on the upward-sloping section, higher AD raises output but also increases costs as bottlenecks appear. Both real GDP and the price level rise.
-
If the economy is on the vertical section, resources are already fully used. Higher AD mainly raises the price level, so inflation increases with little extra real GDP.
This is why Keynesians often support demand-side policies, such as fiscal stimulus, during recessions. However, if the economy is already close to full capacity, the same stimulus may mainly create inflation.
5. What shifts LRAS?
A shift in LRAS means the economy’s productive potential has changed.
LRAS shifts right when the economy becomes able to produce more sustainably. Causes include:
- Higher labour productivity from education, training or better management.
- More capital investment, such as machinery, infrastructure or digital technology.
- Technological progress, including automation or AI.
- A larger or healthier labour force.
- Improved institutions, competition and incentives for enterprise.
LRAS shifts left if productive potential is damaged, for example by war, natural disasters, long-term energy shortages, persistent skills shortages or reduced investment.
In UK context, weak productivity growth since the financial crisis has limited LRAS growth. Brexit-related trade frictions and labour shortages may also affect potential output, while investment in green energy, transport and skills could shift LRAS right over time.
Shift or movement?
Ask: has the economy’s productive capacity changed? If yes, LRAS may shift. If only spending has changed, it is usually an AD shift, not an LRAS shift.
Deciding whether LRAS shifts
-
A temporary rise in household spending increases AD because planned expenditure is higher. It does not directly increase productive capacity, so LRAS does not shift.
-
A fall in imported energy prices reduces firms’ costs, so SRAS shifts right. LRAS shifts only if the lower energy costs permanently improve capacity or investment.
-
A sustained increase in skills training and business investment raises productivity and capital per worker. This increases potential output, so LRAS shifts right.
6. Evaluating the two views
In essays, avoid saying one view is “always right”. The strength of each view depends on the context.
The Neo-classical view is more convincing when labour and product markets are flexible, information is good, workers are mobile, and prices adjust quickly. It supports policies that improve incentives, competition and supply-side performance.
The Keynesian view is more convincing during deep recessions, financial crises or periods of weak confidence. After the 2008 financial crisis and during parts of the COVID-19 period, many economies had spare capacity and demand weakness, so Keynesian arguments were influential.
A strong judgement might say: in the short run, sticky wages and weak demand can keep output below potential; in the long run, sustainable growth still depends on shifting LRAS right through productivity and investment.
In the exam
-
Define LRAS and label diagrams with price level on the vertical axis and real GDP on the horizontal axis.
-
State which model you are using: Neo-classical vertical LRAS or Keynesian non-vertical LRAS.
-
For Neo-classical analysis, explain the adjustment chain: output gap → wage pressure → cost changes → SRAS shift → return to full-employment output.
-
For Keynesian analysis, explain why sticky wages, spare capacity or bottlenecks may stop smooth adjustment.
-
Evaluate using context: size of the output gap, time period, wage flexibility, UK productivity issues and inflation risk.
Check yourself
- Why do Neo-classical economists expect a negative output gap to disappear in the long run?
- What factors can make wages “sticky”?
- Why might an increase in AD create growth in one economy but mostly inflation in another?
