

What you'll learn
- How a PPF shows scarcity, choice and opportunity cost.
- How to identify efficient, inefficient and unattainable combinations of output.
- Why most PPFs are concave and what that says about increasing opportunity cost.
- How movements along and shifts of a PPF link to short-term growth, long-term growth and LRAS.
Starting point: scarcity and choice
Economics begins with scarcity: resources are limited, but human wants are effectively unlimited. Resources are also called factors of production: land, labour, capital and enterprise.
Because resources are scarce, society must choose what to produce. Choosing more of one good usually means producing less of another good.
Opportunity cost
Opportunity cost is the value of the next best alternative foregone when a choice is made.
For example, if an economy uses more workers, machinery and land to build houses, those same resources cannot also be used to produce as many hospitals, roads or consumer goods.
What is a production possibility frontier?
Production possibility frontier (PPF)
A production possibility frontier (PPF) is a diagram showing the maximum possible combinations of two goods or types of goods that an economy can produce, assuming its resources and technology are fixed and used efficiently.
A PPF is a simplified model. It usually assumes:
- The economy produces only two goods, or two broad categories of goods.
- The quantity and quality of resources are fixed in the short run.
- Technology is fixed in the short run.
- Resources can be moved between uses.
- Points on the frontier use resources fully and efficiently.
A common version compares consumer goods, which satisfy wants now, with capital goods, which are used to produce other goods and services in the future.
Reading a PPF diagram
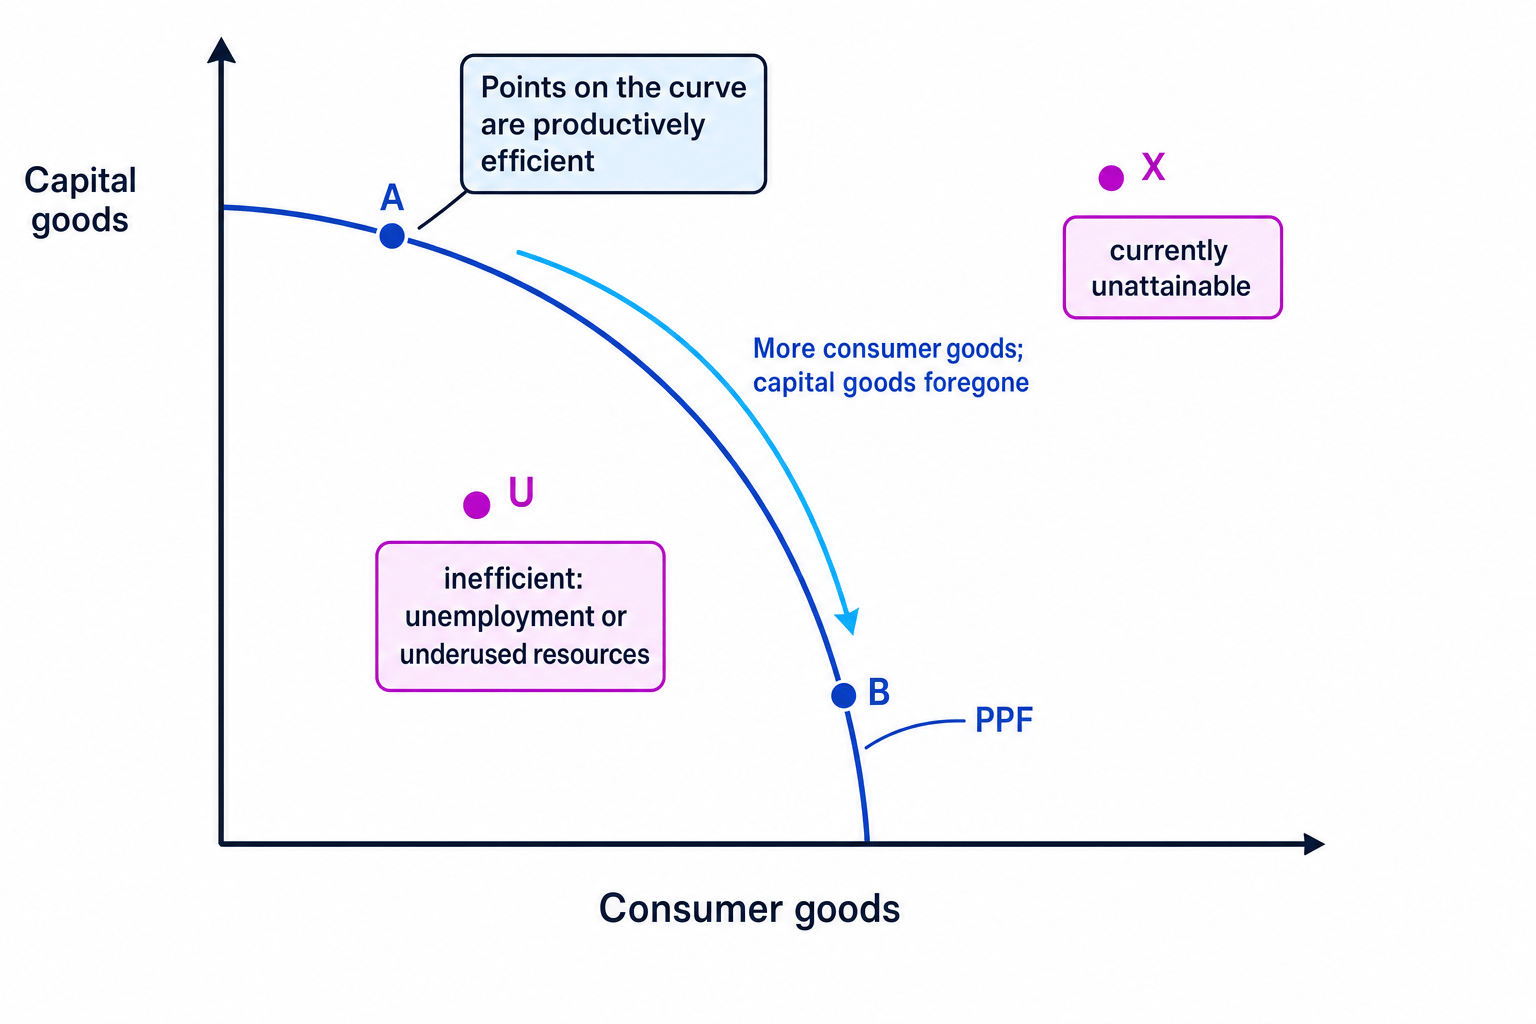
A point on the PPF is productively efficient: the economy cannot produce more of one good without producing less of the other.
A point inside the PPF shows inefficient use of resources. This might be caused by unemployment, idle factories, poor management or underused land.
A point outside the PPF is currently unattainable with existing resources and technology.
Productive efficiency
Productive efficiency means producing the maximum output possible from available resources, or producing a given output at the lowest possible cost.
Productive does not always mean allocative
A point on the PPF is productively efficient, but it is not automatically allocatively efficient. Allocative efficiency means resources are used to produce the combination of goods that best matches society’s preferences.
Opportunity cost on a PPF
A movement along a PPF shows a change in the combination of goods produced. The economy is reallocating resources from one use to another.
The opportunity cost is shown by what must be given up. The marginal opportunity cost means the opportunity cost of producing one more unit of a good.
Opportunity cost per extra consumer good=capital goods given upconsumer goods gained\text{Opportunity cost per extra consumer good}=\frac{\text{capital goods given up}}{\text{consumer goods gained}}Opportunity cost per extra consumer good=consumer goods gainedcapital goods given upCalculating opportunity cost from a PPF
Suppose an economy can choose between these points on its PPF:
- Point A: 20 consumer goods and 90 capital goods
- Point B: 50 consumer goods and 60 capital goods
- Point C: 75 consumer goods and 20 capital goods
- Moving from A to B, consumer goods rise by 30, from 20 to 50.
- Capital goods fall by 30, from 90 to 60, so the opportunity cost is 30 capital goods.
- The opportunity cost per extra consumer good is 30÷30=130 \div 30 = 130÷30=1 capital good.
- Moving from B to C, consumer goods rise by 25, from 50 to 75.
- Capital goods fall by 40, from 60 to 20, so the opportunity cost per extra consumer good is 40÷25=1.640 \div 25 = 1.640÷25=1.6 capital goods.
- The opportunity cost rises as more consumer goods are produced, which suggests a bowed-out PPF.
Why PPFs are usually concave
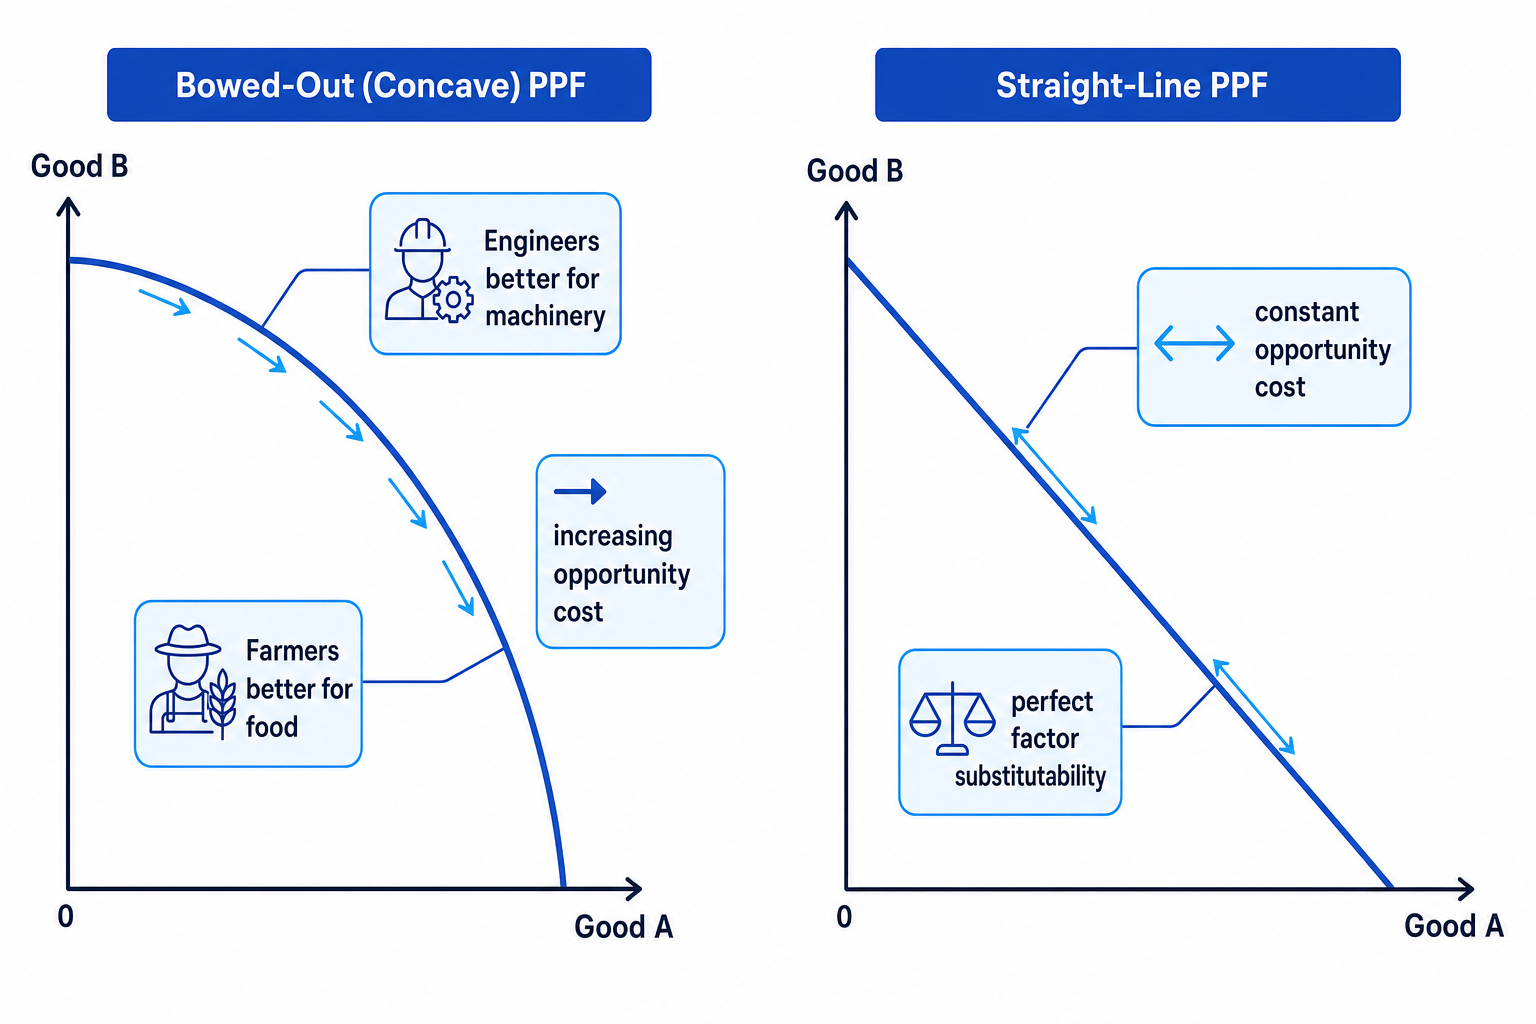
Most PPFs are drawn concave to the origin, also called bowed out. This happens because resources are not perfectly suited to every use.
Factor substitution means moving factors of production from producing one good to producing another. In the real world, factor substitution is usually imperfect. A skilled engineer may be very productive in machinery production, while a farmer may be more productive in food production.
At first, an economy can move the resources best suited to the new activity, so the opportunity cost is low. But as it keeps expanding that activity, it must transfer less suitable resources. Output of the other good is sacrificed at an increasing rate.
Increasing opportunity cost
A concave PPF shows increasing opportunity cost at the margin: each extra unit of one good requires a larger sacrifice of the other good.
A straight-line PPF is a special case. It shows constant opportunity cost, meaning the same amount of one good is given up for each extra unit of the other good.
This would imply perfect factor substitutability, where resources are equally good at producing either good. That is possible in a simple theoretical example, but less realistic for whole economies.
Movements along the PPF
A movement along the PPF means the economy changes what it produces, but its productive capacity has not changed.
For example, if the UK chooses to produce more capital goods such as machinery, transport infrastructure or renewable energy equipment, it may have to produce fewer consumer goods in the short run.
This can support future growth because capital goods increase the economy’s ability to produce later. So there is a trade-off: less current consumption, but potentially higher future productive capacity.
Movement or shift?
If the economy is simply changing the mix of output, it is a movement along the PPF. If the economy’s productive capacity changes, the whole PPF shifts.
Short-term growth: moving towards the frontier
Short-term economic growth can be shown as a movement from a point inside the PPF towards the frontier. This means actual output rises because spare resources are being used more fully.
For example, after a recession, unemployed workers may find jobs and factories may increase production. The economy produces more, but its maximum possible output has not necessarily changed.
Inside-to-frontier is not a PPF shift
If an economy moves from inside the PPF to a point on the PPF, this shows better use of existing resources. It is not long-term growth unless the frontier itself moves outwards.
Long-term growth: shifting the PPF
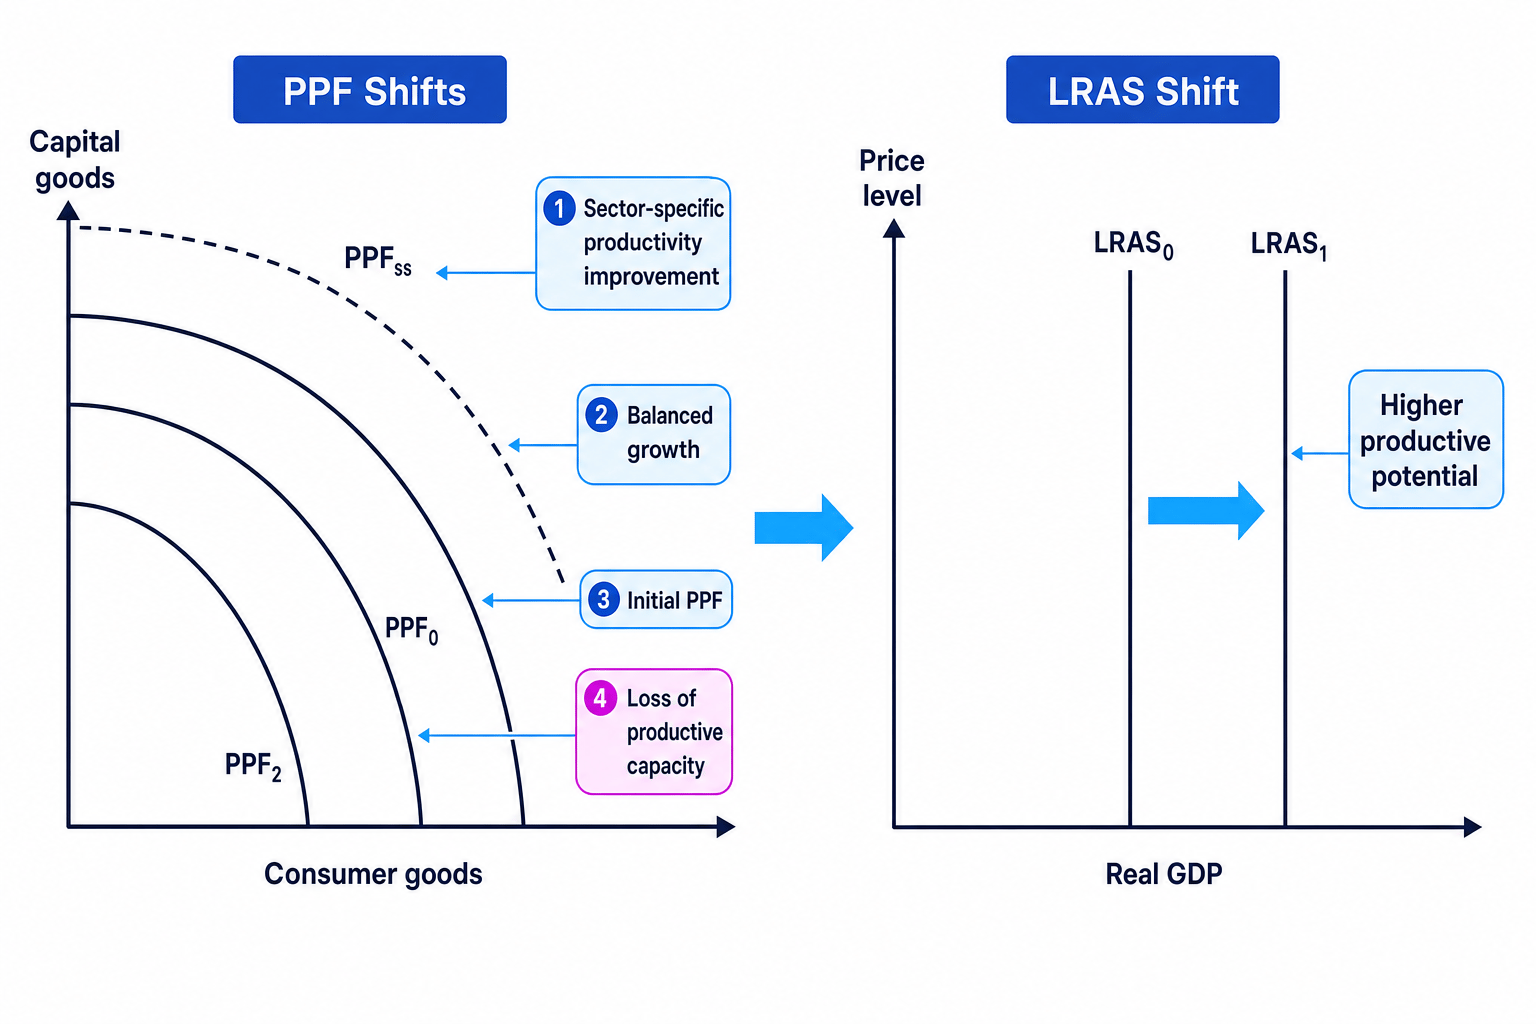
Long-term economic growth means an increase in an economy’s productive potential. On a PPF diagram, this is shown by an outward shift of the frontier.
An outward shift may be caused by:
- More labour, perhaps through population growth or migration.
- Better labour quality, through education, training and healthcare.
- More capital stock, such as machinery, factories, roads and digital infrastructure.
- Technological progress, such as automation or artificial intelligence.
- Higher productivity, meaning more output per unit of input.
- Improved institutions, such as stronger property rights or more efficient regulation.
An inward shift means productive capacity has fallen. This could be caused by war, natural disasters, long-term loss of skills, capital destruction, severe political instability or climate-related damage.
Some shocks only push the economy inside its PPF. For example, temporary supply-chain disruption may stop firms using existing capacity fully, without permanently reducing the economy’s underlying potential.
Skewed shifts and productivity
A PPF does not always shift out evenly. A skewed shift happens when productive capacity increases more for one good than the other.
For example, if new technology mainly improves the production of capital goods, the PPF shifts out more on the capital-goods axis. If productivity improvements mainly affect services or consumer industries, the shift may be larger towards consumer goods.
Long-term economic growth and productivity improvements are closely connected. If UK firms become more productive through better management, digital technology or investment, the economy can produce more output from the same resources.
Classifying growth on a PPF
Suppose an economy has high unemployment after a downturn, then later introduces a major investment programme in robotics and worker training.
- If unemployed workers are rehired using existing machines and technology, the economy moves from inside the PPF towards the frontier.
- This is short-term growth because actual output rises, but productive potential is unchanged.
- If robotics and training raise output per worker, the PPF shifts outwards because the economy can now produce more with the same resources.
- If the productivity gains are largest in manufacturing, the PPF may shift out more towards manufactured or capital goods, creating a skewed outward shift.
Link between the PPF and LRAS
Long-run aggregate supply (LRAS)
Long-run aggregate supply (LRAS) shows the maximum sustainable level of real GDP an economy can produce when resources are fully employed.
The PPF and LRAS both show an economy’s productive potential. The PPF does this using combinations of two goods. LRAS does this using total real GDP.
So, an outward shift of the PPF is linked to a rightward shift of LRAS. Both show an increase in the economy’s capacity to produce in the long run.
In contrast, a movement from inside the PPF to the frontier is more like actual real GDP rising towards potential output. It does not automatically shift LRAS.
Evaluating the PPF model
PPFs are very useful because they show scarcity, choice, opportunity cost, efficiency and growth in one diagram. They are also a strong way to structure analysis in essays.
But they are still a model. They simplify reality by assuming only two goods, fixed technology in the short run and measurable trade-offs. They also do not show who receives the goods, whether the output mix is fair, or whether production creates external costs such as pollution.
In the exam
- Label both axes clearly and state whether a change is a movement along, a movement from inside to the frontier, or a shift of the PPF.
- Link opportunity cost to the lost output of the other good, not just “money cost”.
- For growth questions, distinguish short-term actual growth from long-term potential growth, and connect outward PPF shifts to rightward LRAS shifts.
Check yourself
- Why does a concave PPF show increasing marginal opportunity cost?
- What is the difference between a point inside the PPF and a point outside the PPF?
- How would improved productivity in only one industry affect the shape or position of a PPF?
