What you'll learn
- What efficiency means in economics, and why it matters when resources are scarce.
- How to illustrate productive efficiency using a PPF and cost curves.
- How to illustrate allocative efficiency using the condition P=MCP = MCP=MC.
- How dynamic efficiency and Pareto efficiency extend the idea beyond a single diagram.
Why efficiency matters
Economics starts from scarcity: resources are limited, but wants are unlimited. So economists ask whether resources are being used in the best possible way.
In this topic, efficiency links closely to costs, revenues and profits because firms make output decisions using cost and revenue data, while society cares about whether those decisions maximise welfare.
Efficiency
Efficiency means using scarce resources in a way that minimises waste and maximises the value created for society.
Efficiency is not just about “working hard” or “being fast”. A firm could work very hard producing goods nobody wants. Economists care about both:
- How cheaply output is produced
- Whether the right amount and mix of output is produced
Prerequisites: costs, benefits and the margin
Before productive and allocative efficiency make sense, you need a few building blocks.
Average cost
Average cost (AC) is the cost per unit of output.
AC=TCQAC = \frac{TC}{Q}AC=QTCwhere TC is total cost and Q is output.
Marginal cost
Marginal cost (MC) is the extra cost of producing one more unit of output.
MC=ΔTCΔQMC = \frac{\Delta TC}{\Delta Q}MC=ΔQΔTCMarginal benefit
Marginal benefit (MB) is the extra benefit consumers gain from consuming one more unit. In a simple market diagram, the demand curve can be interpreted as showing consumers’ marginal benefit or willingness to pay.
The efficiency question
Efficiency usually asks two questions: are we producing at the lowest possible average cost? and is the last unit worth at least as much as it costs to produce?
Productive efficiency
Productive efficiency occurs when output is produced at the lowest possible average cost, with no wasted resources.
There are two common ways to illustrate productive efficiency.
Productive efficiency on a PPF
A production possibility frontier (PPF) shows the maximum possible combinations of two goods an economy can produce using existing resources and technology.
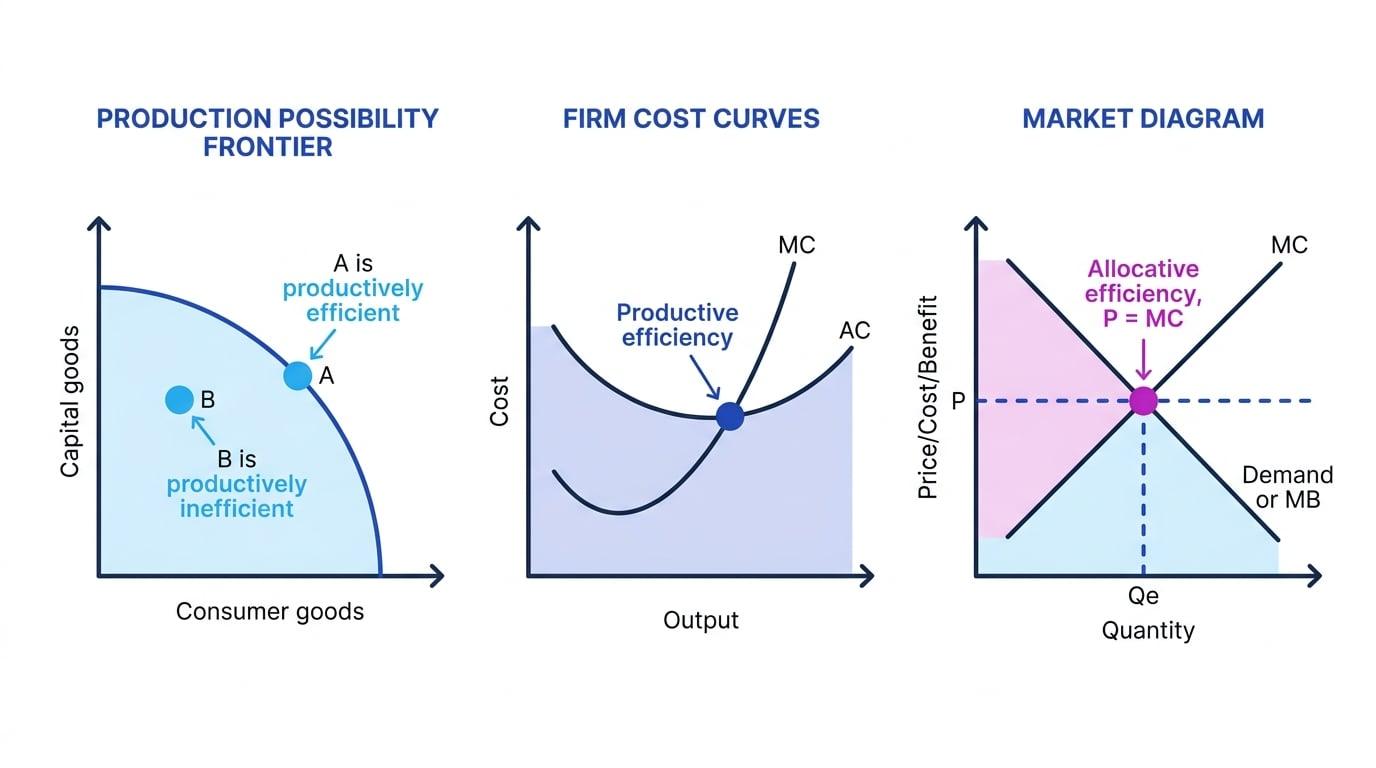
A point on the PPF is productively efficient because the economy is fully using its resources. A point inside the PPF is productively inefficient because some resources are unemployed or used poorly.
Productive efficiency for a firm
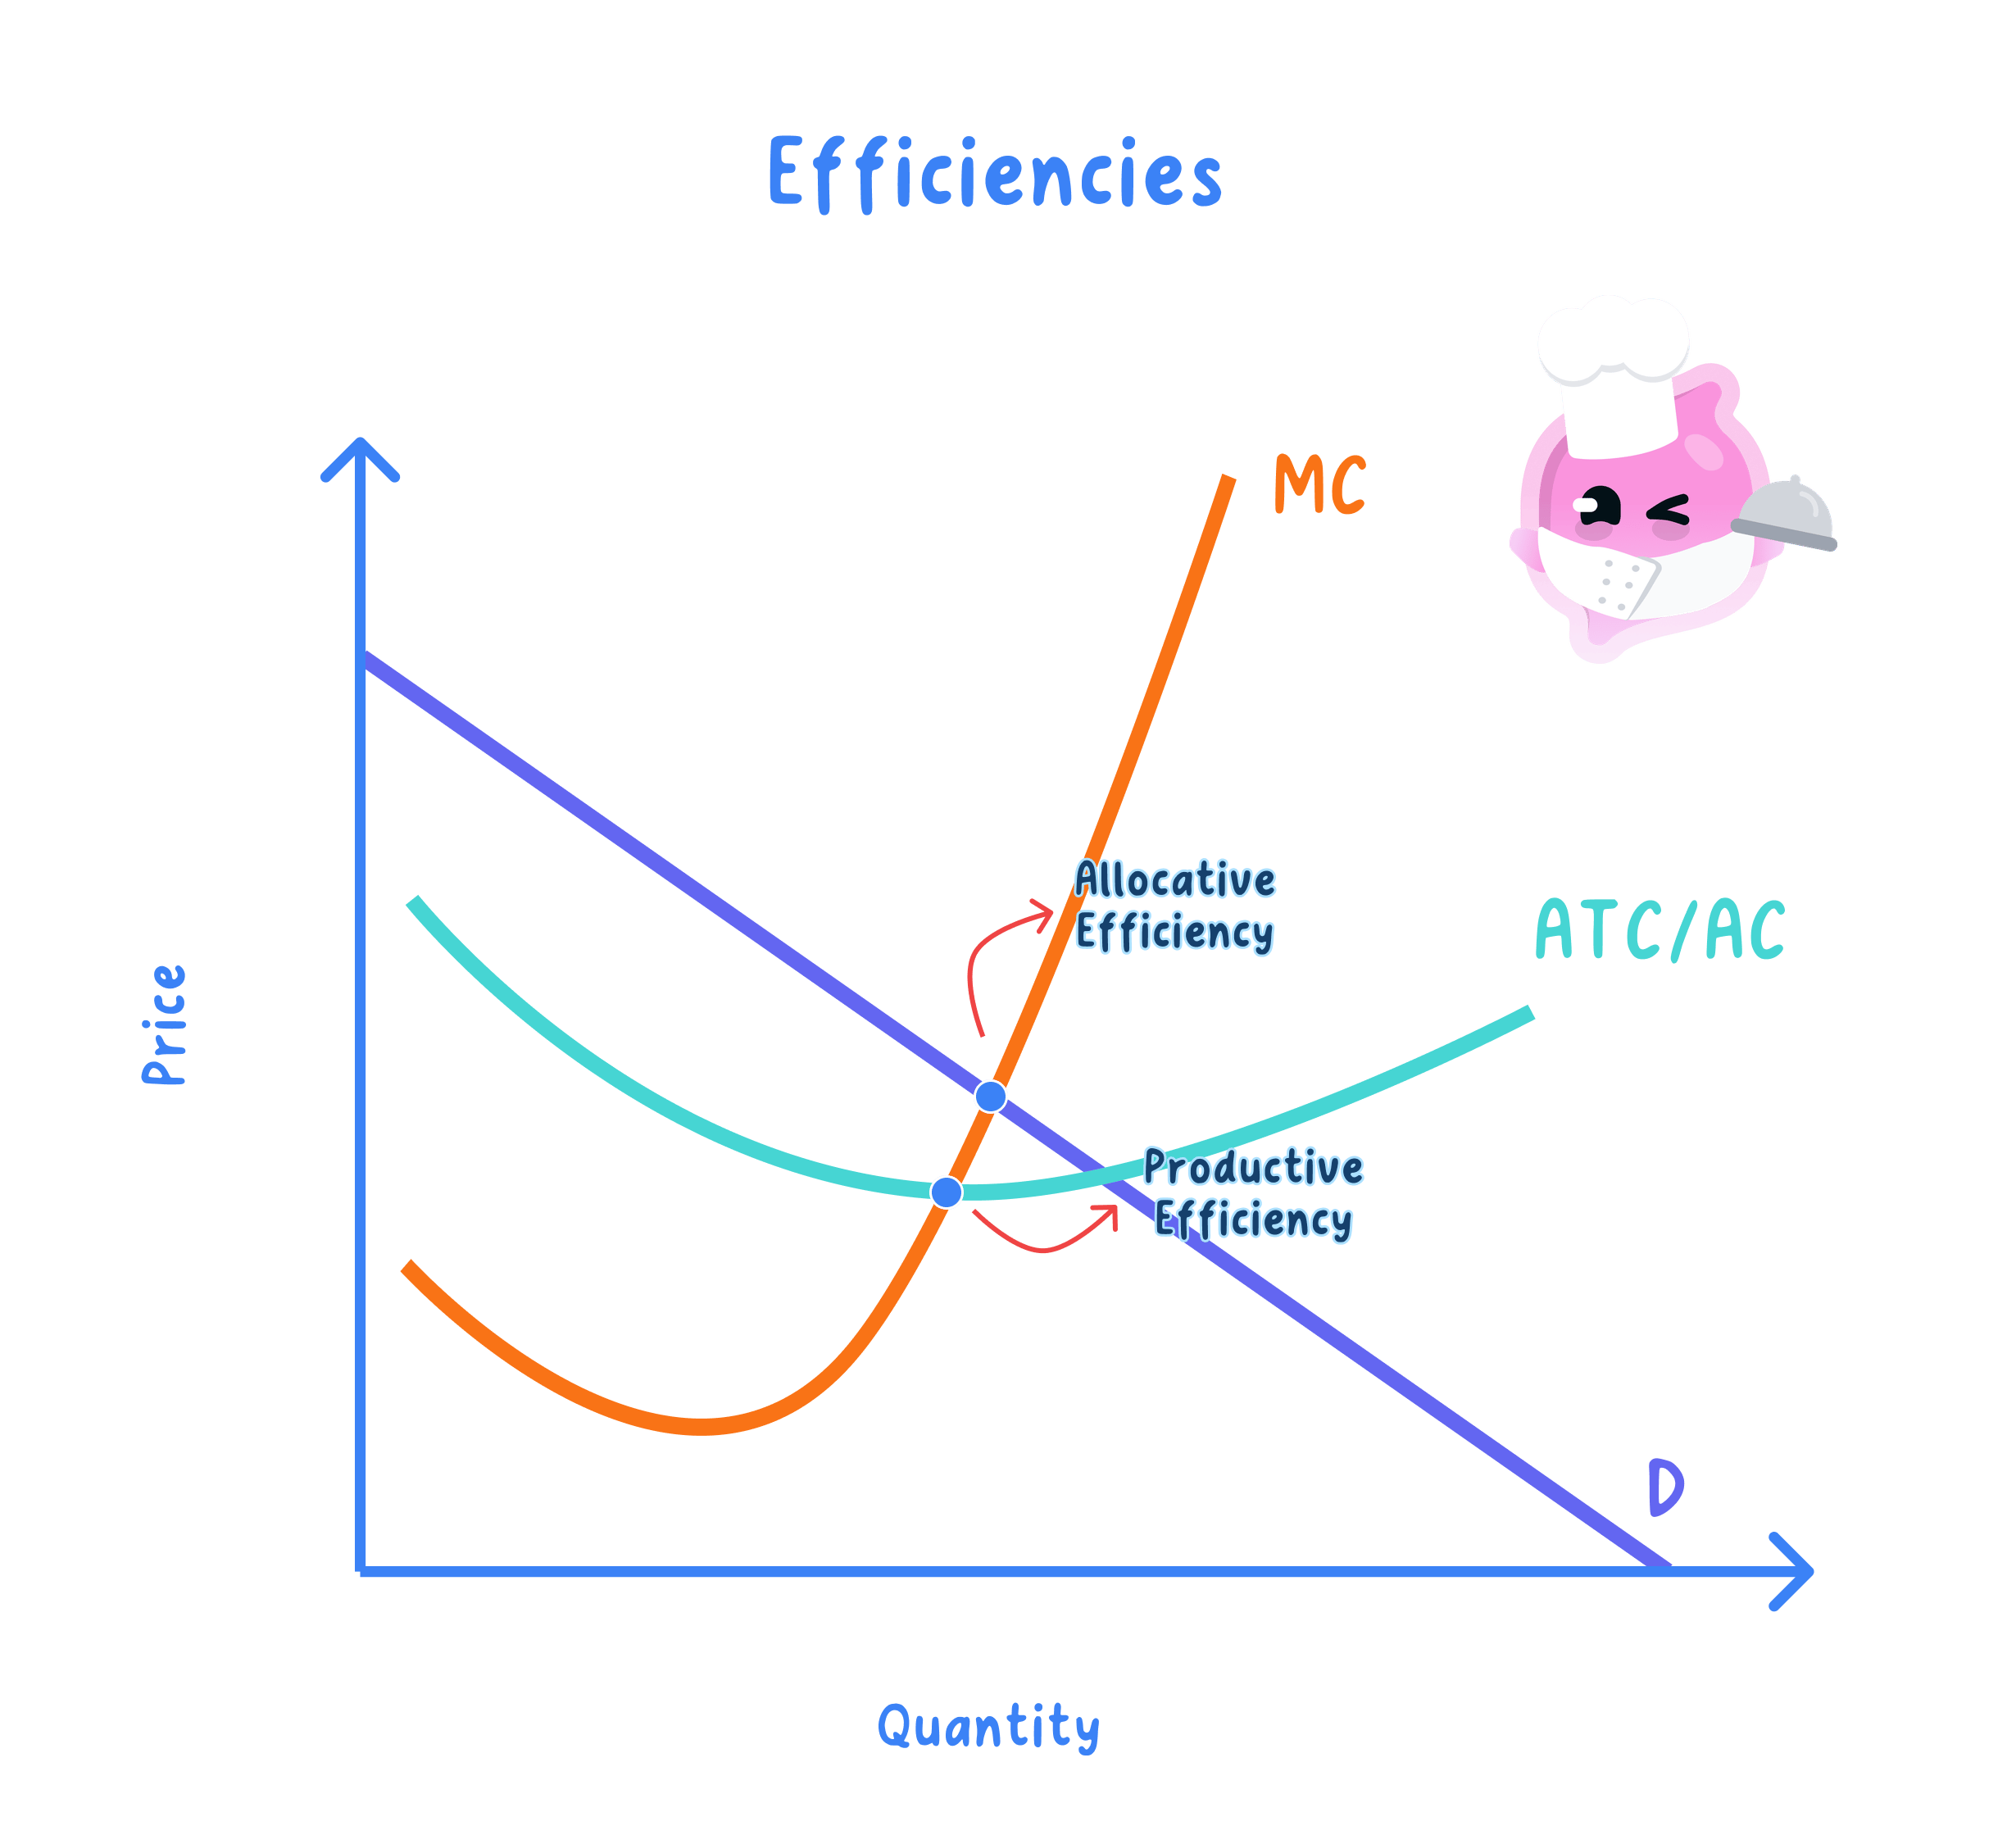
For a firm, productive efficiency occurs where average cost is minimised. On a cost diagram, this is the lowest point of the AC curve. The MC curve passes through the minimum point of AC.
The diagrams below show productive efficiency on a PPF, productive efficiency for a firm, and allocative efficiency in a market.

Finding productively efficient output
A small bakery has the following total costs at different daily output levels.
| Output per day | Total cost | Average cost |
|---|---|---|
| 100 loaves | £220 | £2.20 |
| 200 loaves | £360 | £1.80 |
| 300 loaves | £450 | £1.50 |
| 400 loaves | £580 | £1.45 |
| 500 loaves | £760 | £1.52 |
- Use the average cost formula: AC=TCQAC = \frac{TC}{Q}AC=QTC. For example, at 400 loaves, average cost is
$£580 \div 400 = £1.45per loaf. - Compare the average cost figures across the output levels. The lowest average cost is £1.45.
- Therefore, the productively efficient output is 400 loaves per day because this is where the bakery produces at minimum average cost.
- If the bakery produced 300 loaves, it would not be productively efficient because average cost would be higher at £1.50 per loaf.
Confusing productive efficiency with maximum output
Productive efficiency does not mean producing as much as possible. It means producing a given output at the lowest average cost, or operating on the PPF rather than inside it.
Allocative efficiency
Allocative efficiency occurs when resources are distributed so that society produces the combination of goods and services consumers value most. In a simple market, this occurs where price equals marginal cost: P=MCP = MCP=MC.
The logic is:
- Price (P) reflects the value consumers place on the last unit, assuming no externalities.
- Marginal cost (MC) reflects the opportunity cost of producing the last unit.
- If P>MCP > MCP>MC, consumers value another unit more than it costs to make, so output is too low.
- If P<MCP < MCP<MC, the last unit costs more to produce than consumers value it, so output is too high.
- Allocative efficiency occurs where P=MCP = MCP=MC.
Another way to express the same idea is:
MB=MCMB = MCMB=MCThis means the marginal benefit to society equals the marginal cost to society.
Identifying allocative efficiency from data
A local bus market has the following estimated marginal benefits and marginal costs.
| Quantity of journeys per day | Marginal benefit | Marginal cost |
|---|---|---|
| 1,000 | £5.00 | £2.00 |
| 2,000 | £4.20 | £2.60 |
| 3,000 | £3.50 | £3.20 |
| 4,000 | £2.90 | £3.80 |
| 5,000 | £2.40 | £4.50 |
- Compare marginal benefit and marginal cost at each quantity. If MB is greater than MC, producing more increases welfare.
- At 3,000 journeys, MB is £3.50 and MC is £3.20, so the extra journeys are still worth more than they cost.
- At 4,000 journeys, MB is £2.90 and MC is £3.80, so the extra journeys cost more than consumers value them.
- The allocatively efficient output lies between 3,000 and 4,000 journeys. If output must be chosen in batches of 1,000, 3,000 journeys is the best option shown.
Private costs may not equal social costs
The condition P=MCP = MCP=MC only gives social allocative efficiency if market prices reflect all costs and benefits. With externalities, such as pollution from production or health benefits from vaccination, private market outcomes may be inefficient.
Productive vs allocative efficiency
These two ideas are related, but they are not the same.
| Type of efficiency | Main question | Diagram condition |
|---|---|---|
| Productive efficiency | Is output made at the lowest average cost? | Minimum AC, or on the PPF |
| Allocative efficiency | Is society producing the right amount? | P=MCP = MCP=MC, or MB=MCMB = MCMB=MC |
A firm can be productively efficient but allocatively inefficient. For example, a monopoly might produce each unit at low cost, but restrict output to keep prices high. That may mean price is above marginal cost, so society would benefit from more output.
A firm can also be allocatively efficient without being productively efficient if it produces the right quantity but wastes resources while doing so.
Quick comparison
Productive efficiency is about cost minimisation. Allocative efficiency is about welfare maximisation.
Dynamic efficiency
Dynamic efficiency
Dynamic efficiency occurs when firms improve efficiency over time through investment, innovation, research and development, new technology, or better production methods.
This is different from productive efficiency at one moment in time. A firm may not be producing at the lowest possible cost today because it is investing heavily in new machinery, staff training or product development. In the long run, that investment may lower costs or improve quality.
Dynamic efficiency is especially relevant in industries such as pharmaceuticals, renewable energy, artificial intelligence, electric vehicles and telecommunications.
Assessing dynamic efficiency in broadband
A broadband provider earns supernormal profit and invests part of it in faster fibre networks.
- In the short run, investment spending may raise the firm’s costs, so current productive efficiency may not improve immediately.
- Over time, the new network may allow faster speeds, lower maintenance costs and better service quality.
- If consumers gain from improved quality or lower future prices, the firm has achieved dynamic efficiency.
- However, if the firm keeps profits high without improving service, supernormal profit does not automatically mean dynamic efficiency.
Short run versus long run
Productive and allocative efficiency often focus on a point in time. Dynamic efficiency focuses on whether the economy becomes more efficient over time.
Pareto efficiency
Pareto efficiency
Pareto efficiency occurs when it is impossible to make one person better off without making someone else worse off.
This is a very important idea in welfare economics, but it is also quite limited. A Pareto efficient allocation might still be very unequal. For example, if one person owns nearly everything, it may be impossible to help others without taking something from them — but that does not mean the outcome is fair.
Applying the Pareto test
Suppose a council has spare land that nobody currently uses and can turn it into a free public park.
- If residents gain recreation space and nobody loses access, income or wellbeing, the project is a Pareto improvement.
- If nearby homeowners suffer noise or congestion, then some people are made worse off, so it is not a pure Pareto improvement.
- If compensation is possible, economists may still argue the project improves overall welfare, but it would no longer be a simple Pareto improvement.
Assuming Pareto efficiency means fairness
Pareto efficiency is about whether further mutually beneficial changes are possible. It does not prove that resources are distributed fairly.
Efficiency in market structures
In perfect competition, firms are more likely to achieve both productive and allocative efficiency in the long run because competition pushes price down and removes supernormal profit. In the long-run equilibrium of perfect competition:
P=MC=ACP = MC = ACP=MC=ACThis means firms produce where price equals marginal cost and average cost is minimised.
In monopoly, allocative efficiency is less likely because the firm may restrict output and charge a price above marginal cost. However, monopoly may sometimes support dynamic efficiency if high profits fund innovation.
This gives you useful evaluation for essays: market power can reduce static efficiency, but may improve dynamic efficiency if profits are reinvested successfully.
What shifts the efficiency diagrams?
Efficiency diagrams are not fixed. They can change when economic conditions change.
Changes affecting productive efficiency
Productive efficiency can improve if average costs fall due to:
- New technology
- Better management
- Training and higher labour productivity
- Economies of scale
- Improved infrastructure
In diagram terms, these factors can shift cost curves downwards or move the PPF outwards.
Changes affecting allocative efficiency
Allocative efficiency changes if demand or marginal cost changes.
- If consumer preferences rise, demand and marginal benefit shift right.
- If production costs rise, marginal cost shifts upwards or leftwards.
- If technology lowers costs, marginal cost shifts downwards or rightwards.
A new efficient output is found where the new demand or marginal benefit curve intersects the new marginal cost curve.
In the exam
- Define the type of efficiency precisely before analysing it: productive means minimum AC; allocative means P=MCP = MCP=MC or MB=MCMB = MCMB=MC.
- Use the correct diagram: PPF or AC curve for productive efficiency; demand and MC for allocative efficiency.
- Evaluate carefully: a firm may be inefficient in the short run but dynamically efficient in the long run, and Pareto efficiency does not guarantee fairness.
Check yourself
- Why is the lowest point of the AC curve the productively efficient output?
- What happens to welfare if price is greater than marginal cost?
- How can a monopoly be allocatively inefficient but potentially dynamically efficient?