What you'll learn
- How unemployment is measured using the Labour Force Survey and the Claimant Count.
- The main types and causes of unemployment, including cyclical, structural and real wage unemployment.
- The economic and social costs for households, firms, government and the wider economy.
- How demand-side and supply-side policies can reduce unemployment — and when they might fail.
The basic idea
Unemployment is one of the key macroeconomic objectives because it affects living standards, government finances, productivity and social wellbeing.
Unemployment
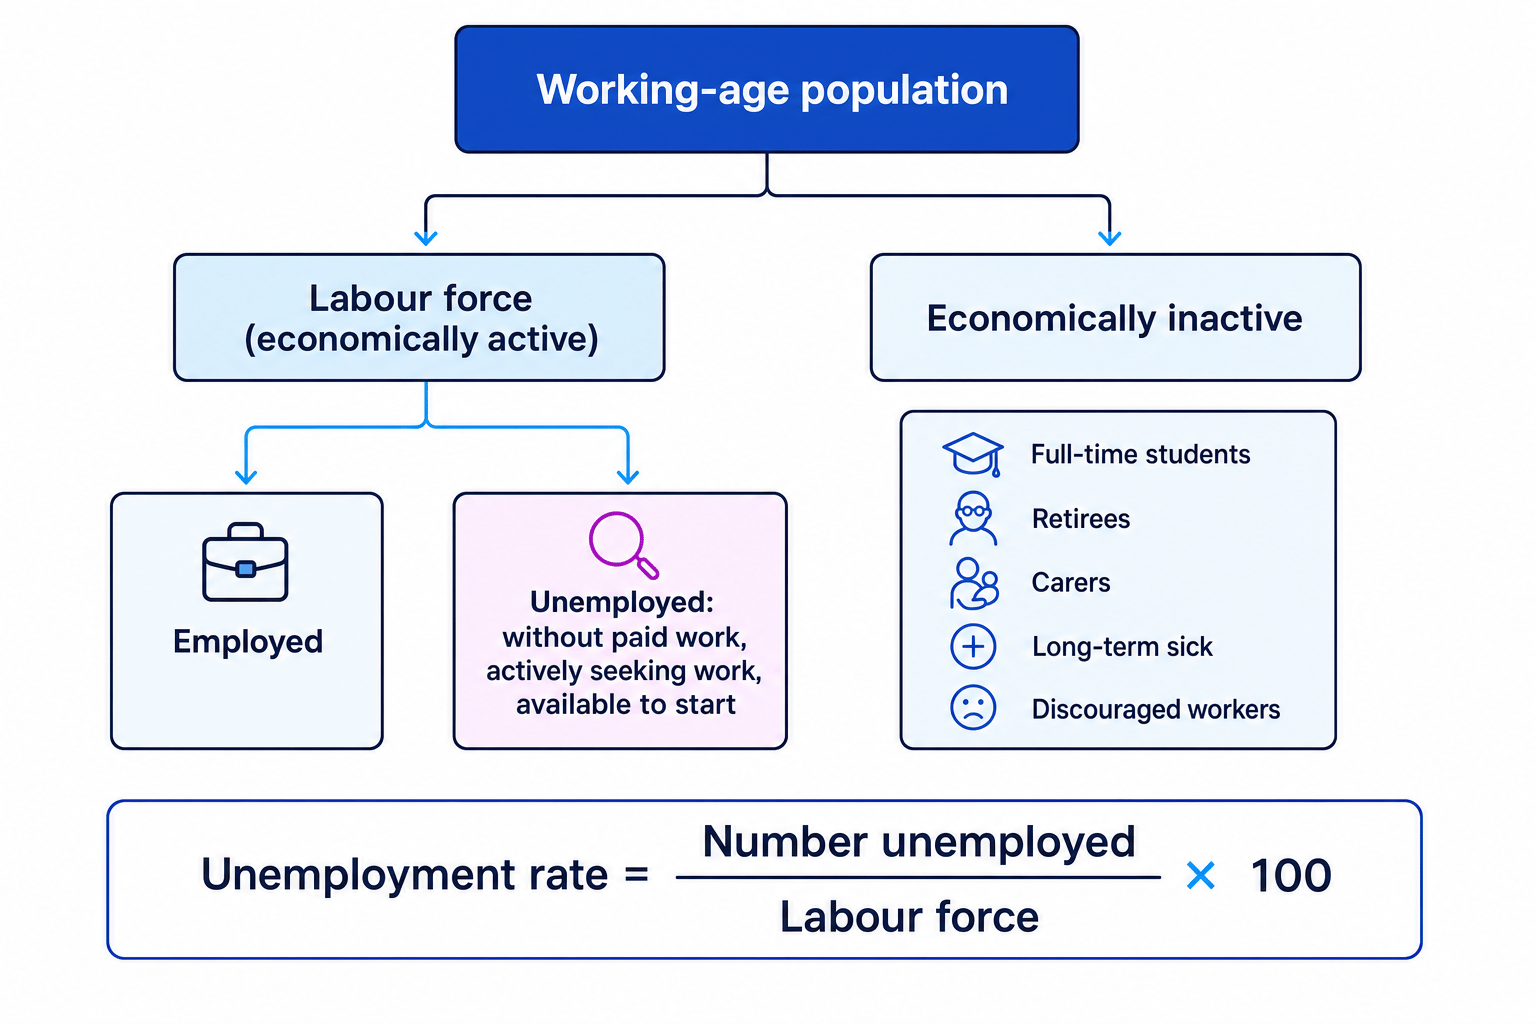
Unemployment occurs when people are without paid work, are available to start work, and are actively seeking work.
Unemployment is not the same as “not working”. Some people are not in work but are not counted as unemployed because they are not looking for work or are not available to start.
The labour force
To measure unemployment properly, you first need the idea of the labour force.
Labour force
The labour force is the number of people who are employed plus the number who are unemployed but actively seeking work. It is also called the economically active population.
People outside the labour force are economically inactive. This may include full-time students, retired people, carers, people with long-term illness, and discouraged workers who have stopped looking for work.
The unemployment rate is calculated as:
Unemployment rate=Number unemployedLabour force×100\text{Unemployment rate} = \frac{\text{Number unemployed}}{\text{Labour force}} \times 100Unemployment rate=Labour forceNumber unemployed×100Calculating unemployment and inactivity rates
Suppose an economy has a working-age population of 54.0 million, employment of 33.4 million, ILO unemployment of 1.6 million, and a Claimant Count of 1.2 million.
-
Calculate the labour force: 33.4m+1.6m=35.0m33.4\text{m} + 1.6\text{m} = 35.0\text{m}33.4m+1.6m=35.0m.
-
Calculate the unemployment rate: 1.6m35.0m×100=4.57%\frac{1.6\text{m}}{35.0\text{m}} \times 100 = 4.57\%35.0m1.6m×100=4.57%, so unemployment is about 4.6%.
-
Calculate economic inactivity: 54.0m−35.0m=19.0m54.0\text{m} - 35.0\text{m} = 19.0\text{m}54.0m−35.0m=19.0m, giving an inactivity rate of 19.0m54.0m×100=35.2%\frac{19.0\text{m}}{54.0\text{m}} \times 100 = 35.2\%54.0m19.0m×100=35.2%.
-
Compare the measures: the Claimant Count is 1.2 million, which is below ILO unemployment by 0.4 million, showing that not every unemployed person claims unemployment-related benefits.
Measuring unemployment
The Labour Force Survey and ILO measure
The UK’s main unemployment measure uses the Labour Force Survey, based on the International Labour Organization definition. A person is counted as unemployed if they are without work, have actively looked for work recently, and are available to start soon.
This is useful because it includes people who are unemployed but not claiming benefits, and it allows comparisons between countries.
The Claimant Count
The Claimant Count measures people claiming unemployment-related benefits, such as Jobseeker’s Allowance or Universal Credit while required to seek work.
It is based on administrative data, so it can be timely and local. However, it depends heavily on benefit rules, eligibility, sanctions and whether people choose to claim.
Claimant Count ≠ unemployment
Do not treat the Claimant Count as the “true” unemployment figure. Some unemployed people do not claim benefits, and some Universal Credit claimants may be in low-paid or low-hours work.
Problems with measurement
Unemployment data can be inaccurate because of:
- Hidden unemployment: people who want work but are not officially counted as seeking it.
- Underemployment: people have a job but want more hours or higher-skilled work.
- Discouraged workers: people stop searching because they believe no suitable jobs exist.
- Sampling issues in surveys, including low response rates and later revisions.
- Changing benefit rules, which affect the Claimant Count even if labour market conditions have not really changed.
Types and causes of unemployment
Unemployment can be caused by either weak demand in the economy or supply-side problems in labour markets.
Demand-side cause: cyclical unemployment
Cyclical unemployment is caused by a fall in aggregate demand.
Aggregate demand
Aggregate demand is total planned spending in the economy: consumption, investment, government spending, and net exports.
If real GDP falls below the economy’s productive potential, there is a negative output gap. Firms sell less output, so they need fewer workers.
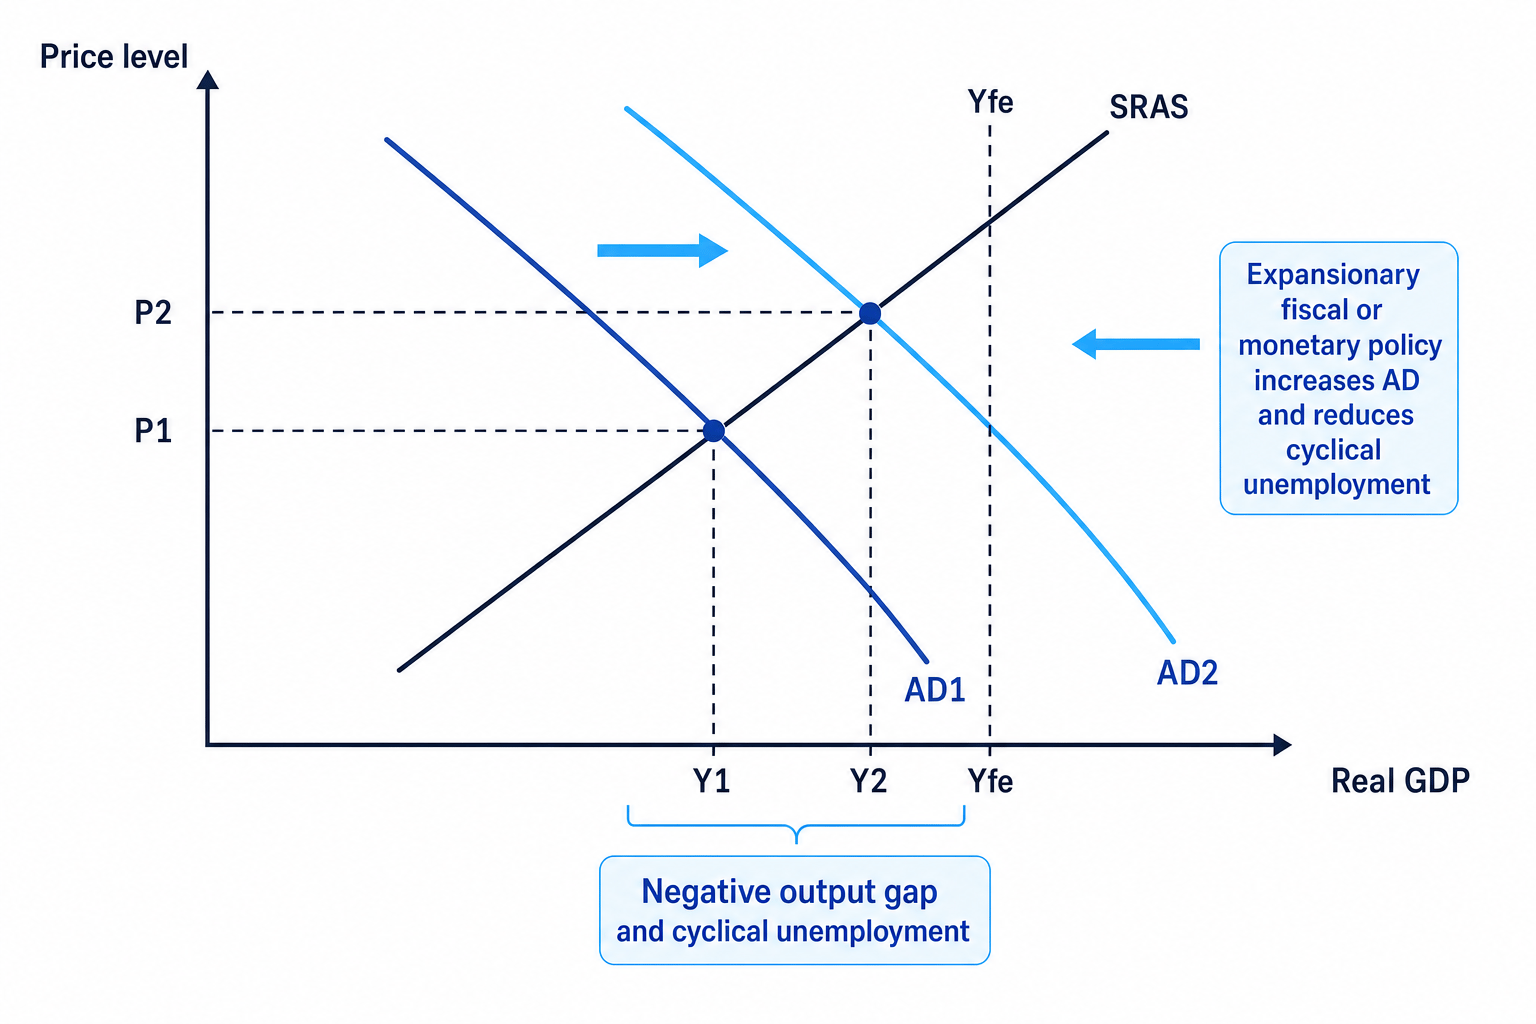
Keynesian economists argue that cyclical unemployment can persist because wages and prices may be slow to adjust downwards. Neo-Classical economists are more likely to argue that unemployment reflects wage rigidities and labour market imperfections, and that markets tend to self-correct if wages are flexible.
Supply-side causes
Supply-side unemployment comes from problems in factor markets, especially the labour market.
Common types include:
- Frictional unemployment: short-term unemployment between jobs, such as a graduate searching for their first role.
- Structural unemployment: workers’ skills or locations do not match available jobs, often because of technology, trade, deindustrialisation or changing consumer demand.
- Seasonal unemployment: predictable unemployment at certain times of year, such as tourism or agriculture.
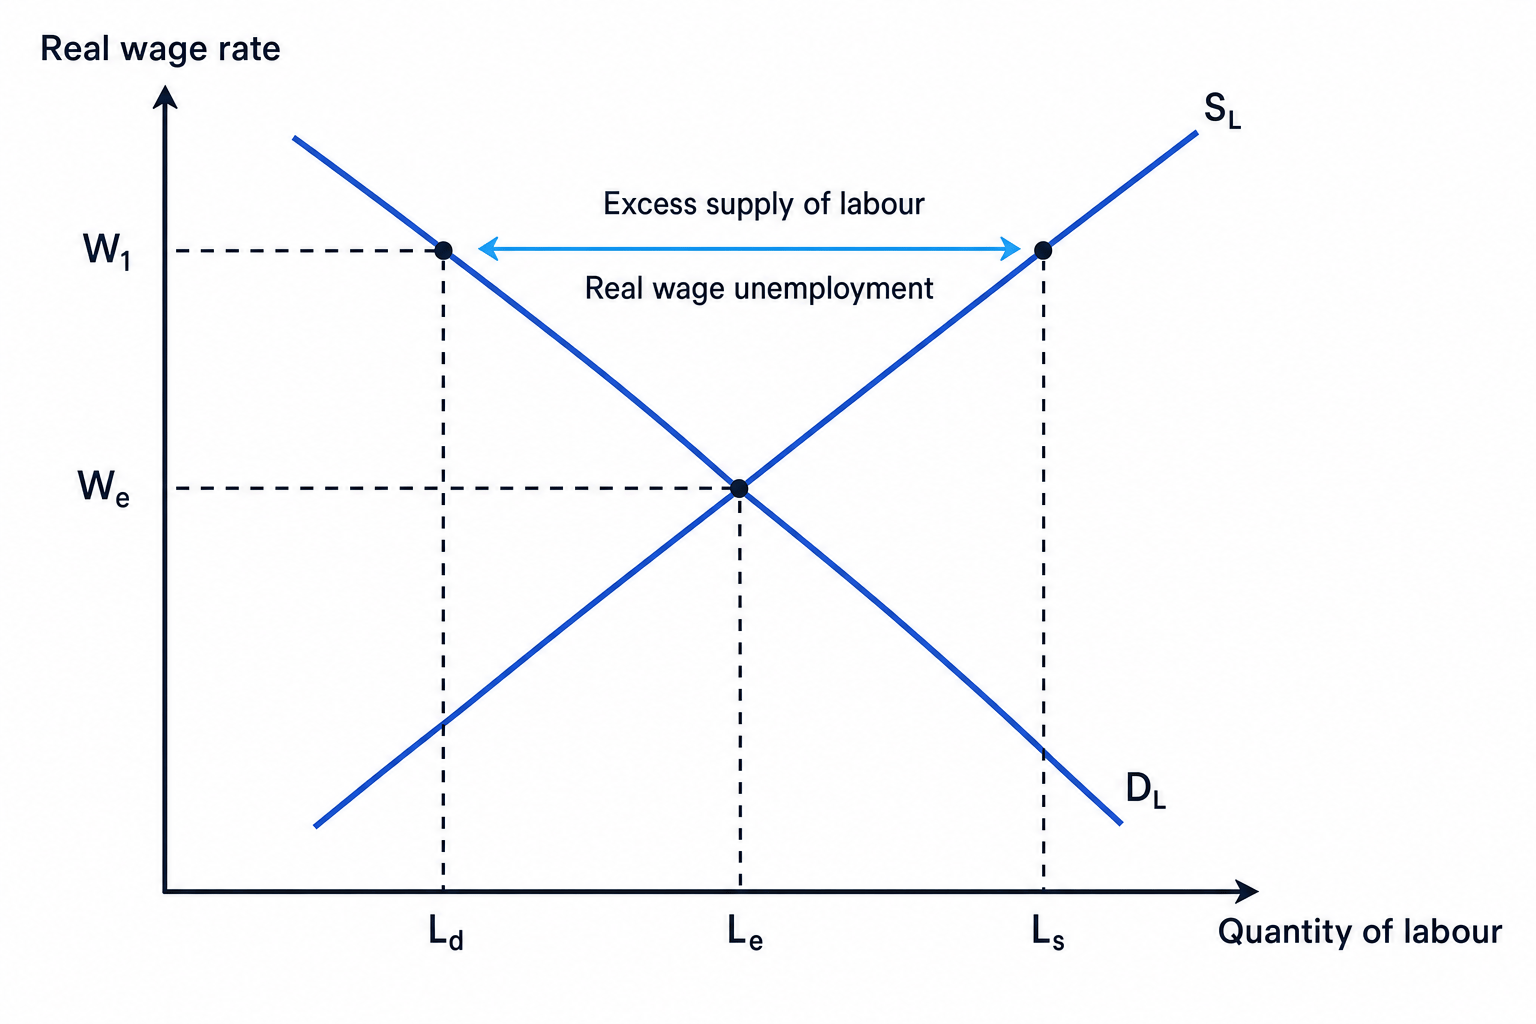
- Real wage unemployment: wages are held above the market-clearing level, so labour supplied is greater than labour demanded.
Natural rate of unemployment
The natural rate of unemployment is the unemployment rate that remains when there is no cyclical unemployment. It includes frictional, structural and some seasonal unemployment, and is closely linked to the idea of the NAIRU: the non-accelerating inflation rate of unemployment.
Diagnosing the cause of unemployment
A car factory closes in the West Midlands because production shifts towards electric vehicles, while nearby workers lack battery engineering and software skills.
-
Identify the trigger: the problem is not mainly a fall in national spending, but a mismatch between workers’ skills and firms’ needs.
-
Classify the unemployment: this is structural unemployment caused by occupational immobility of labour.
-
Choose a suitable response: retraining, apprenticeships, support for technical education and help for firms investing in new production methods are more targeted than a general tax cut.
Minimum wage nuance
A minimum wage only creates real wage unemployment if it is set above the market-clearing wage in a competitive labour market. In a monopsony labour market, a well-set minimum wage can increase both wages and employment.
Costs of unemployment
Unemployment creates both economic and social costs.
For households, unemployment reduces income, consumption and confidence. It may also damage mental health, family stability and future employability.
For governments, unemployment reduces income tax and National Insurance receipts while increasing welfare spending. This worsens the budget position.
For firms, unemployment may reduce sales because households spend less. However, firms may also face less wage pressure if there is a larger pool of available workers.
For the economy, unemployment means wasted resources and lost output. Long-term unemployment can create hysteresis, where workers lose skills, motivation and employability, making unemployment harder to reduce later.
Estimating the fiscal cost of unemployment
A recession increases unemployment by 150,000. On average, each unemployed person means £4,500 less tax revenue and £6,500 more welfare spending per year.
-
Calculate lost tax revenue: 150,000×£4,500=£675 million150{,}000 \times \text{£}4{,}500 = \text{£}675\text{ million}150,000×£4,500=£675 million.
-
Calculate extra welfare spending: 150,000×£6,500=£975 million150{,}000 \times \text{£}6{,}500 = \text{£}975\text{ million}150,000×£6,500=£975 million.
-
Add the two effects: £675 million plus £975 million gives a fiscal deterioration of £1.65 billion per year, before considering lower VAT receipts or long-run scarring.
Solutions to unemployment
The best policy depends on the cause.
Match the policy to the cause
Cyclical unemployment usually needs demand-side policy. Structural, frictional and real wage unemployment usually need supply-side policy.
Demand-side solutions
If there is a negative output gap, the government can use expansionary fiscal policy, such as higher government spending or lower taxes, to increase aggregate demand.
The Bank of England can also use expansionary monetary policy, such as lower interest rates or quantitative easing, to encourage borrowing, investment and consumption.
These policies may reduce cyclical unemployment by raising real GDP. However, they are less suitable if unemployment is structural. They may also increase inflation, worsen government debt, or leak into imports rather than domestic jobs.
Recent UK context matters: during periods of high inflation, such as the cost-of-living squeeze after global energy and supply-chain shocks, expansionary demand-side policy may be harder to justify because it could add to inflationary pressure.
Supply-side solutions
Supply-side policies aim to improve the working of labour markets and reduce the natural rate of unemployment.
Policies to improve occupational mobility include:
- retraining schemes
- apprenticeships and vocational education
- better careers information
- subsidies for firms providing workplace training
Policies to improve geographical mobility include:
- relocation support
- improved transport infrastructure
- more affordable housing in high-employment regions
- childcare support to help parents access work
Policies to improve incentives to work include:
- reducing high marginal tax or benefit withdrawal rates
- reforming welfare to reduce unemployment traps
- making childcare cheaper
- supporting flexible work
Policies to increase labour market flexibility include reducing excessive hiring costs or reforming regulations. But this needs careful evaluation: weaker worker protection may reduce job security, worsen inequality and create low-paid insecure employment.
Evaluation shortcut
A strong evaluation often says: “This policy works best if the unemployment is caused by…” Then compare short-run versus long-run effects, inflation risk, cost, and whether workers actually gain the right skills.
Full employment does not mean zero unemployment
In economics, full employment usually means unemployment is at its natural rate. There will still be some frictional and structural unemployment because people change jobs, move regions, retrain, or enter and leave the labour force.
Trying to push unemployment below the natural rate using demand-side policy may create inflation without sustainable extra employment.
In the exam
-
Define the measure you are using: ILO unemployment, Claimant Count, unemployment rate, labour force or inactivity.
-
Match the policy to the cause: demand-side policies for cyclical unemployment; supply-side policies for structural, frictional or real wage unemployment.
-
Evaluate with conditions: spare capacity, inflation, time lags, government debt, skills mismatch, regional effects and whether the policy targets the actual labour market problem.
Check yourself
- Why can the Labour Force Survey and Claimant Count give different unemployment figures?
- What is the difference between cyclical unemployment and structural unemployment?
- Why might full employment still include some unemployment?