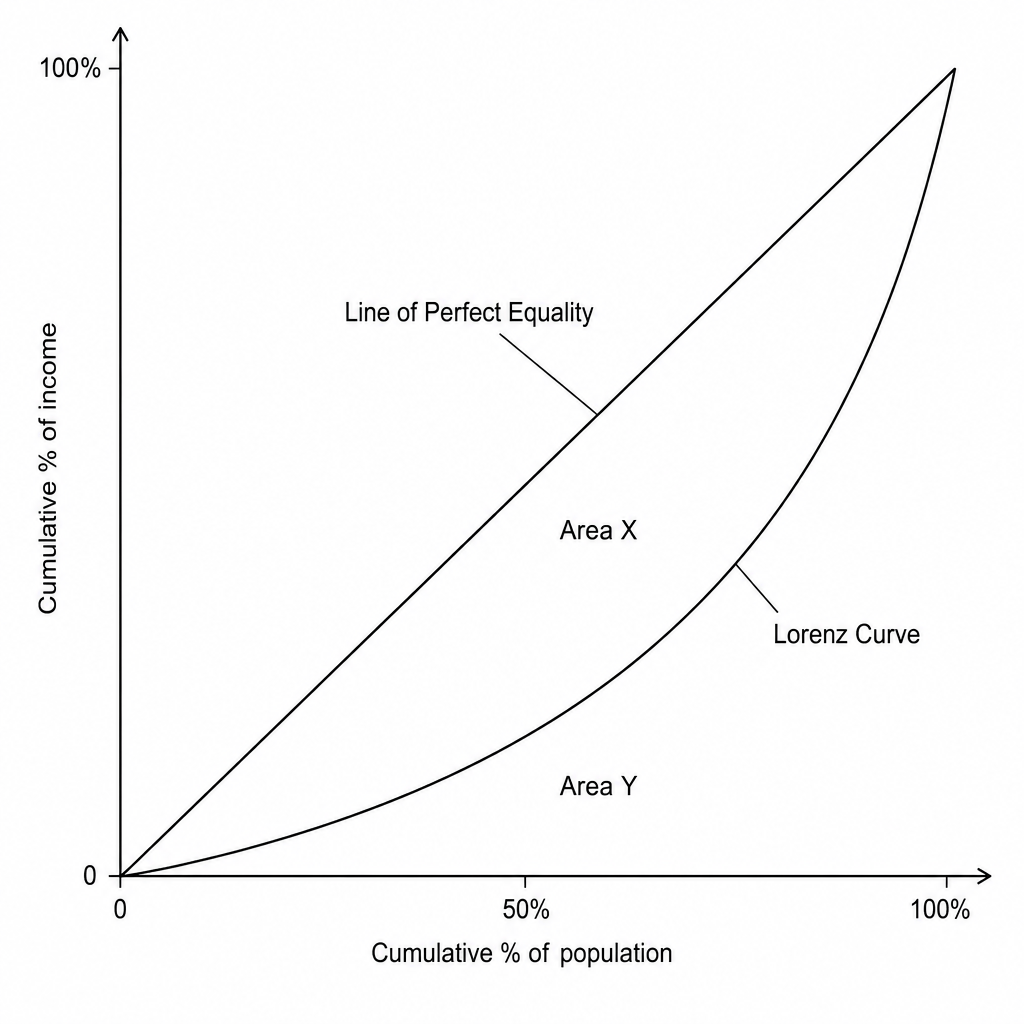
Geographically, France exhibits significant regional income inequality. According to research from the Paris School of Economics, the country's national Gini coefficient for disposable income stands at 0.32. This inequality is driven by several structural factors. First, human capital development is highly unequal; young people in poorer peripheral regions often face lower educational opportunities. In the northern industrial basin of Hauts-de-France, for example, only 18% of disadvantaged 18-year-old state school students transition into higher education, compared with 43% of their peers in the affluent Île-de-France (Paris) region.
Secondly, state infrastructure spending remains heavily concentrated around metropolitan hubs. In recent years, approximately 31% of public funds earmarked for rail transit development was allocated exclusively to the Île-de-France network. Proponents of this allocation argue that public investment must follow passenger density, yet this leaves rural and older industrial regions struggling with connectivity.
Economists argue that these deep-seated inequalities cannot be resolved swiftly through isolated interventions. Regional disparities in structural transport links, local school funding, and regional development initiatives compound over generations. To bridge these gaps, some policymakers suggest long-term devolution strategies, similar to those historically utilized in other European nations, prioritizing sustained education funding over immediate business subsidies.
Using a Lorenz curve diagram, explain how income inequality is measured using the Gini coefficient. Refer to Extract A in your answer.