Wealth and Income Inequality
Income: a flow of earnings received over a period of time, such as wages, interest, rent and profit.
Wealth: a stock of assets held at a single point in time, such as property, shares, pensions and savings.
- Because assets accumulate over time and can be inherited, wealth is usually distributed far more unequally than income.
- The two also reinforce each other, since wealth generates income through rent, dividends and interest, so wealth inequality tends to breed income inequality.
The Lorenz Curve and Gini Coefficient
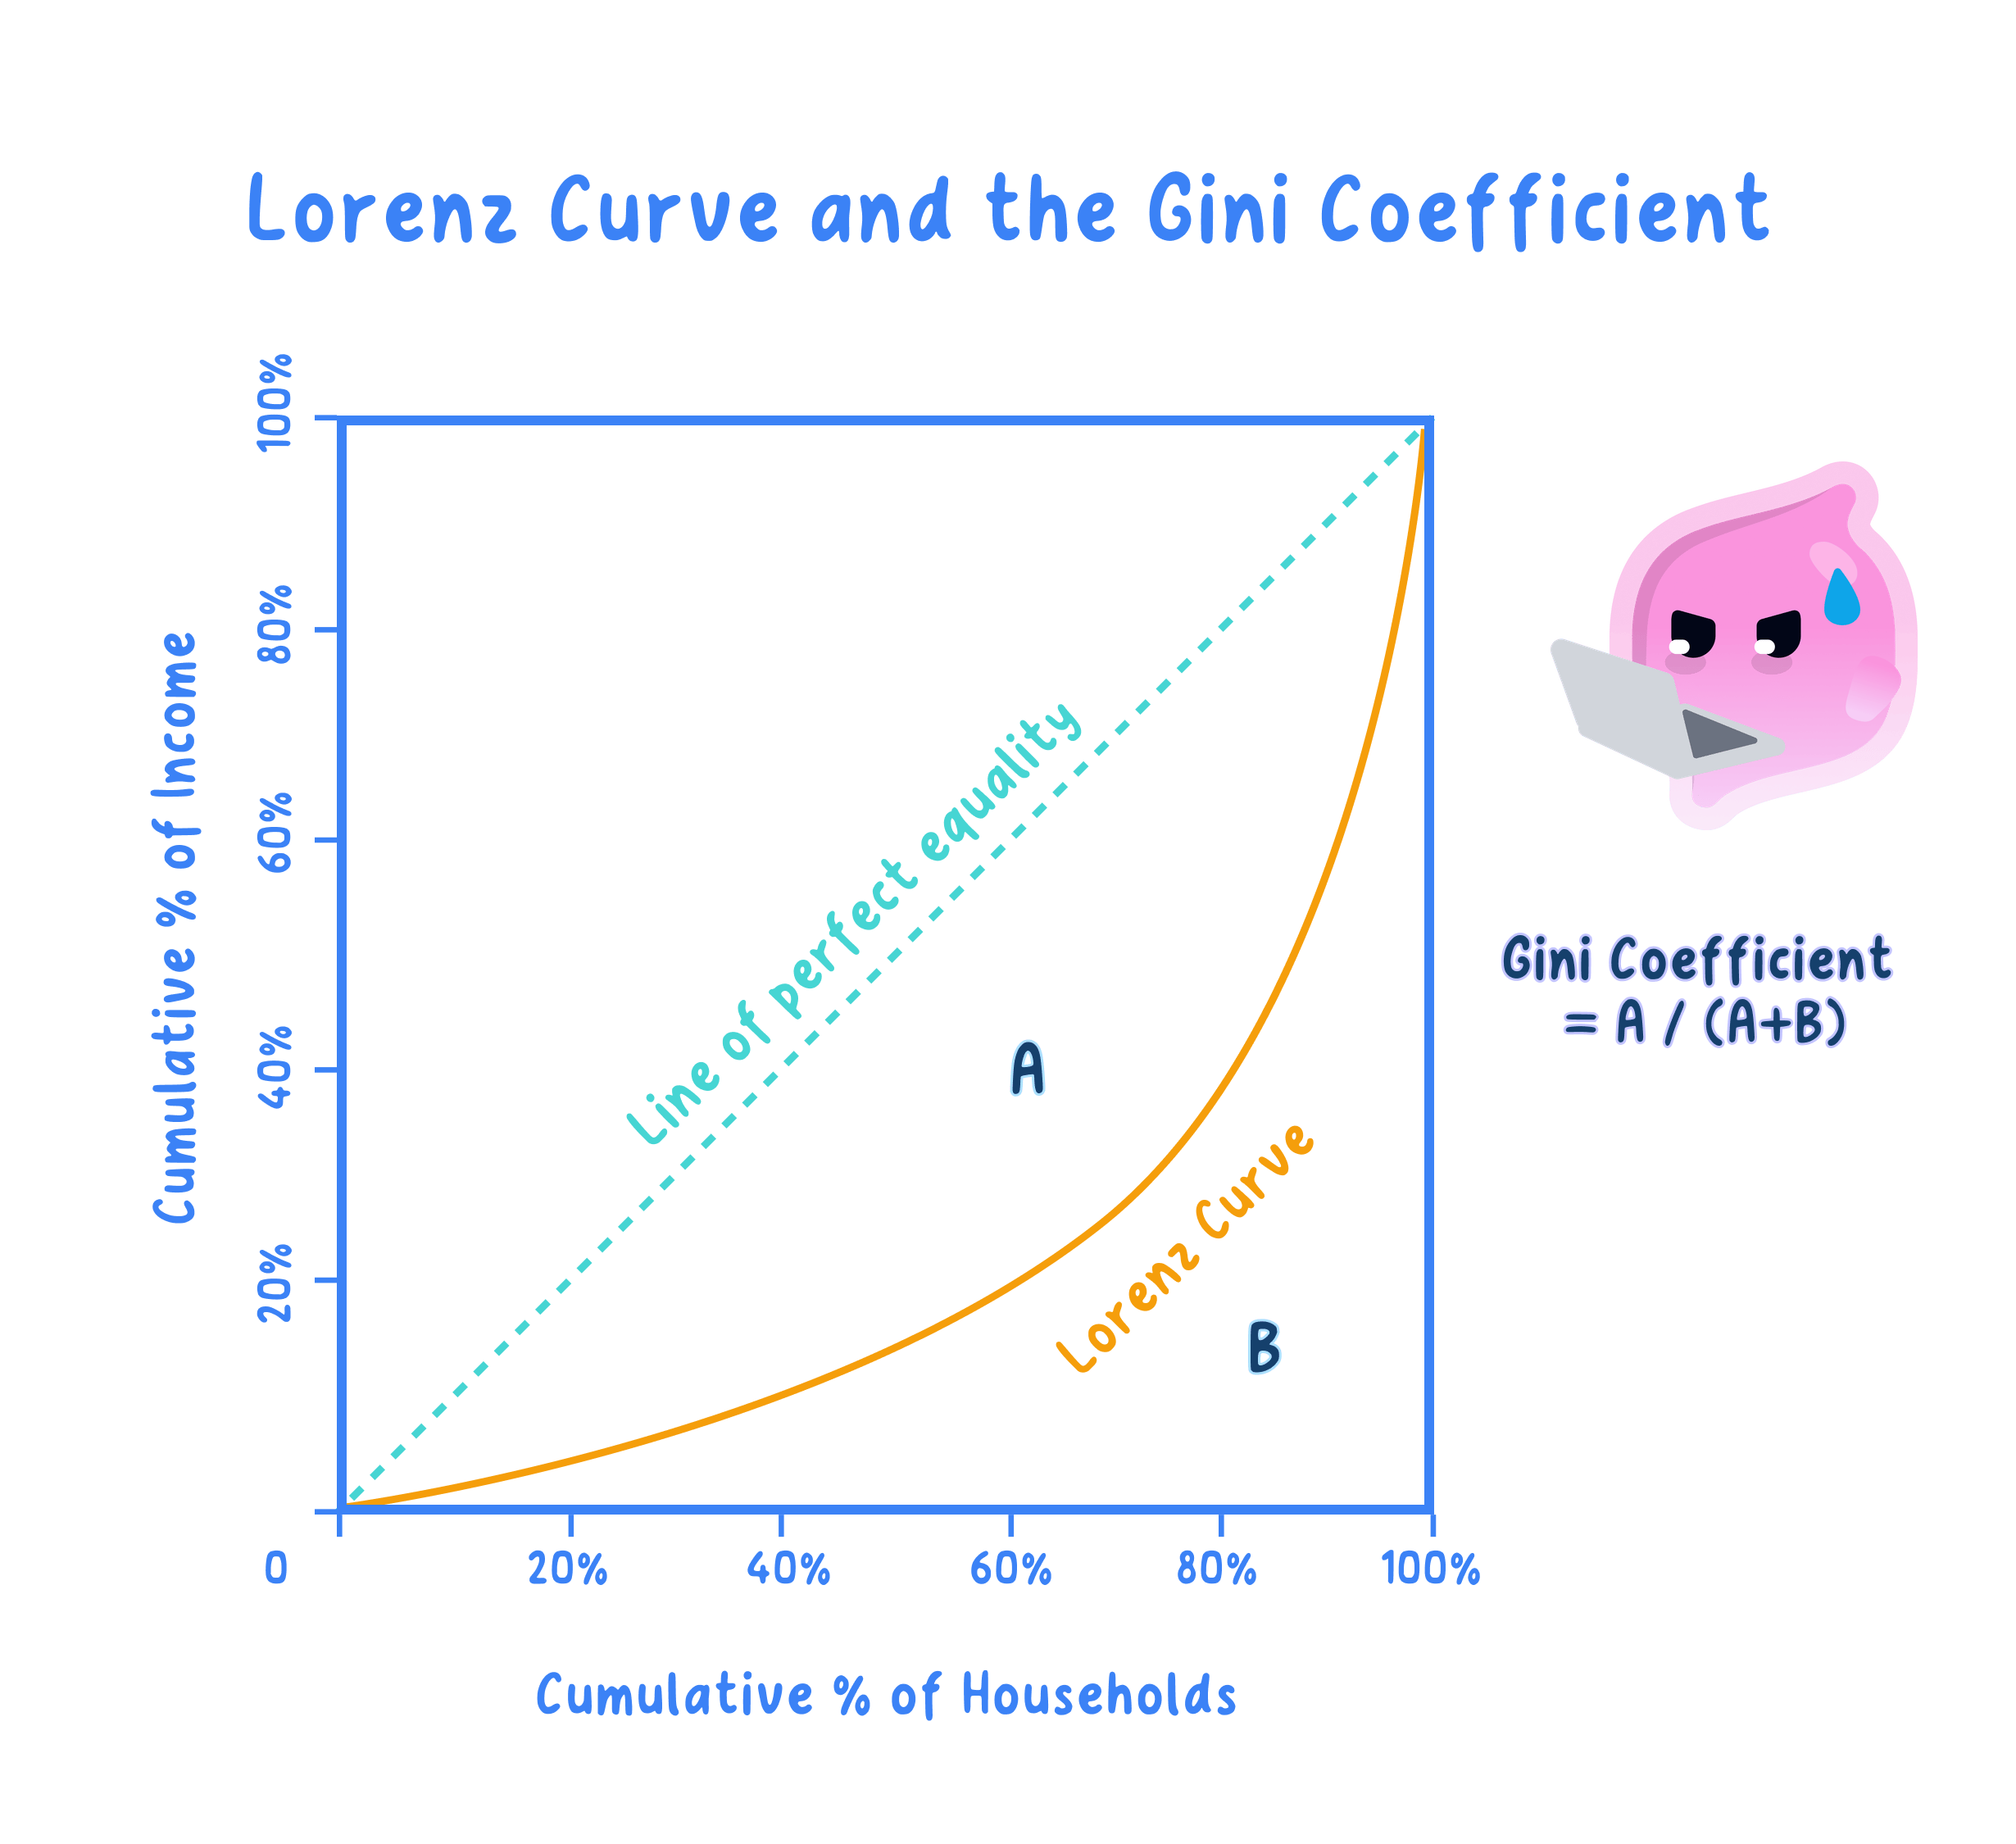
Lorenz curve: a diagram showing income inequality by plotting the cumulative share of income against the cumulative share of the population.
Gini coefficient: a single number, derived from the Lorenz curve, that summarises income inequality.
- The horizontal axis shows the cumulative percentage of the population ranked from poorest to richest, and the vertical axis shows the cumulative percentage of income.
- The 45-degree line is the line of perfect equality, along which each share of the population receives an equal share of income.
- The Lorenz curve bows below this line, and the further the curve lies from the line, the greater the inequality.
- The Gini coefficient is the ratio of the area between the line of equality and the Lorenz curve, call it A, to the whole area beneath the line of equality, A plus B.
- It ranges from 0 (perfect equality) to 1 (perfect inequality), so a higher Gini, like a curve bowing further out, means greater inequality.
- Real economies span the range: Denmark and other Nordic countries have among the world's lowest Gini coefficients, whereas Brazil and South Africa are among the most unequal, with high Gini values.
Suppose the area between the line of equality and the Lorenz curve, A, is 0.15. On the unit-square diagram the whole area beneath the line of equality, A + B, is always 0.5. The Gini coefficient is:
G=AA+B=0.150.5=0.3 G = \dfrac{A}{A + B} = \dfrac{0.15}{0.5} = 0.3 G=A+BA=0.50.15=0.3A Gini of 0.3 is typical of a relatively equal advanced economy such as those in Scandinavia. If inequality widened so that A rose to 0.25, the Gini would climb to 0.5, closer to the highly unequal levels seen in Brazil or South Africa.
Causes of Inequality
- Within a country, differences in skills and wages create income gaps, as workers with scarce, highly demanded skills command higher wages than the low-skilled.
- Unequal ownership of assets and inheritance concentrates wealth, since those who own property and shares receive extra income and can pass assets to the next generation.
- Education shapes opportunity by determining which workers can access higher-paid employment.
- The tax and benefits system can narrow or widen inequality depending on how progressive it is, as progressive taxes and welfare transfers redistribute income towards poorer households.
- Globalisation and technology raise the rewards to capital and high-skilled labour while reducing demand for low-skilled work.
- Between countries, differences in development, resources and capital drive inequality, as richer countries hold more physical and human capital and stronger institutions.
Development and Inequality
Kuznets hypothesis: the idea that inequality tends to rise in the early stages of development and then fall as an economy matures, tracing an inverted-U.
- Early industrialisation concentrates the gains among owners of capital and urban workers.
- As the economy matures, education, welfare and wage growth spread the benefits more widely and inequality falls.
- The evidence is mixed, however, as inequality has risen again in several advanced economies, which challenges the simple Kuznets pattern.
Capitalism and Inequality
Capitalism: an economic system based on the private ownership of capital and the means of production.
Equity-efficiency trade-off: the tension between distributing income more fairly and preserving the incentives that drive effort and growth.
- Private ownership of capital is a major source of inequality, because owners of firms and assets receive profit and returns that are distributed more unequally than wages.
- Yet unequal rewards perform an incentive function, since the prospect of higher income motivates workers to train and entrepreneurs to invest and innovate.
- Returns to capital have tended to grow faster than wages from labour, r>gr > gr>g, concentrating wealth among asset owners over time.
- The case for greater equality rests partly on the diminishing marginal utility of income: a given sum adds more to the welfare of a poor household than a rich one, so redistribution can raise total welfare.
Is inequality always bad?
- Some inequality is beneficial because unequal rewards create incentives to work, train, take risks and innovate, which can raise efficiency and growth.
- But high inequality can lower welfare, since the diminishing marginal utility of income means a given sum is worth more to a poor household than to a rich one.
- Extreme inequality can even harm growth itself by limiting the poor's access to education, health and capital and by weakening social cohesion.
- On balance, it depends on the level and cause: inequality that rewards genuine effort differs from inequality entrenched by inherited wealth, so the judgement turns on the equity-efficiency trade-off.
- Define wealth as a stock and income as a flow before discussing measurement or causes.
- Describe the Lorenz curve in words, naming both axes, and link the Gini coefficient to the areas on it.
- Reach a judgement using the equity-efficiency trade-off rather than asserting one side.
- Do not confuse wealth, a stock of assets, with income, a flow of earnings.
- A Lorenz curve closer to the 45-degree line means more equality, not less.
- Do not treat all inequality as harmful, as some rewards effort and supports growth.
- What is the difference between wealth and income?
- What do the two axes of a Lorenz curve show?
- What range does the Gini coefficient take, and what do 0 and 1 mean?
- What does the Kuznets hypothesis predict about inequality during development?
- What is the equity-efficiency trade-off?
